
The Art of Data View Design: Catering to Different Analytical Needs in Adobe Customer Journey Analytics
Introduction
A common challenge for organizations implementing Adobe Customer Journey Analytics (CJA) is delivering relevant data to different teams. Marketing teams need campaign performance metrics, product teams require user behavior insights, and customer experience teams focus on journey analysis and friction points. One solution lies in strategically configuring Data Views as the flexible layer that transforms raw data into actionable business insights.
Data Views in CJA allow administrators to curate data presentations for specific business contexts without duplicating underlying data or creating siloed analytics implementations. By configuring Data Views for different stakeholder needs, organizations maximize their analytics investment while ensuring each team accesses insights tailored to their requirements. These Data Views also power multiple egress destinations beyond Analysis Workspace, including Excel Report Builder, Adobe Analytics Mobile App, BI SQL extension, Full Table Export, and Reporting API integrations.
A well-designed CJA implementation functions as a universal translator for diverse teams. While everyone shares the same underlying information, each specialist needs it presented in their "native language" to be effective. Marketing professionals speak in terms of campaign attribution and ROI. Product teams understand feature adoption rates and user flows. Customer experience analysts communicate through journey maps and satisfaction scores. Data Views act as specialized translators, transforming raw data into the precise language and context each team needs without changing the core information. Similar to how a skilled interpreter keeps the meaning intact while adjusting the delivery, carefully configured Data Views show the same customer journey data in ways that connect with different business functions. This allows everyone to get the most value from a unified analytics system.
This blog post examines best practices and strategic approaches for designing specialized Data Views that address the unique analytical needs of marketing, product, and customer experience teams. We'll show how Data Views transform raw data into tailored analytical environments that speak each department's language while maintaining consistent data governance. Through practical examples and implementation strategies, we'll demonstrate how to maximize your CJA implementation with purpose-built analytics that help teams extract actionable insights aligned with their specific business goals.
Navigating the Data Views Configuration Process
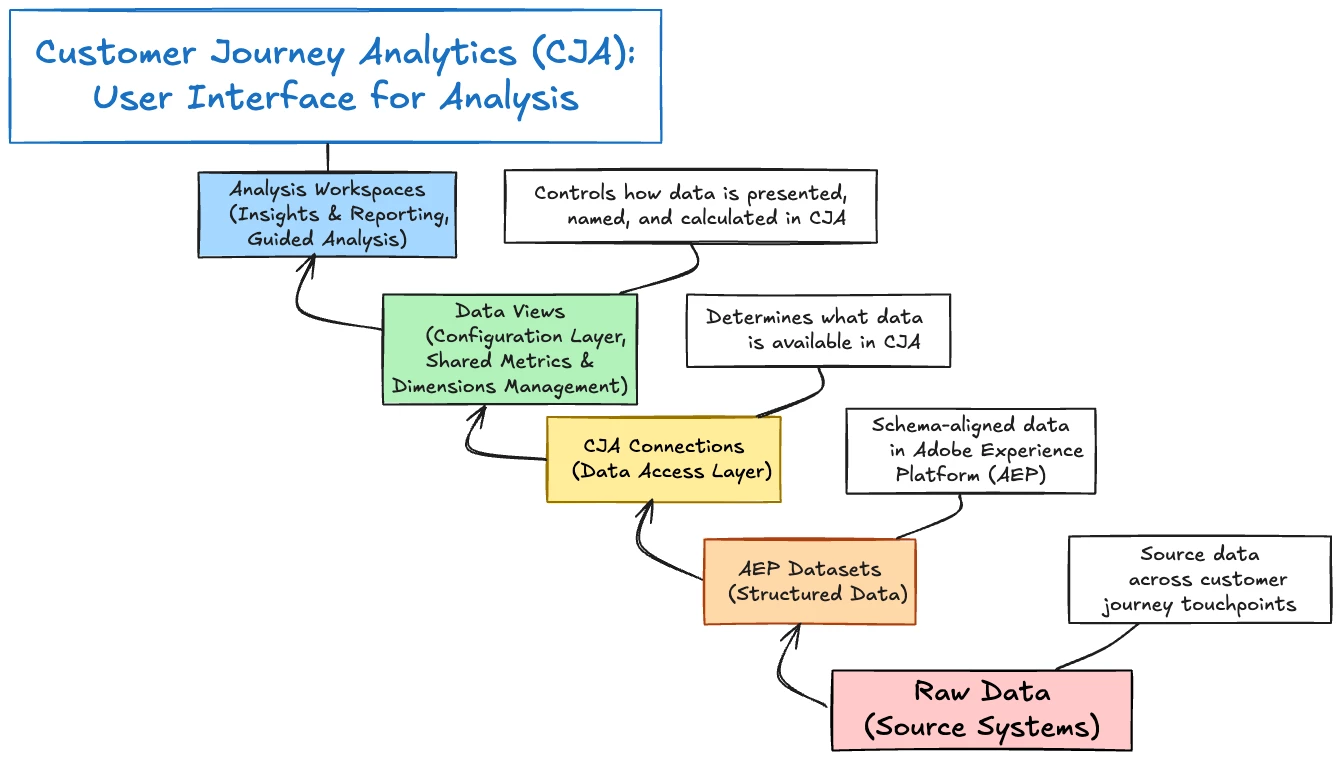
Data Views serve as the critical bridge between your raw data Adobe Experience Platform (AEP) datasets through to CJA Connections and the Analysis Workspaces where practitioners derive insights. While Connections determine what data is available, Data Views determine how that data is presented to users by controlling everything from naming conventions to metric calculations and intrinsic attribution models.
An important consideration for implementation design is how the flexibility of Data Views can significantly influence your data collection strategy. Rather than implementing separate, specialized events for each unique interaction type, organizations can adopt a more streamlined approach using generic event structures with descriptive parameters. For example, instead of creating distinct event types like "product_view," "add_to_cart," and "checkout_initiated," implementers can collect a single "action" event with an accompanying "action_name" parameter. This simplified collection methodology reduces implementation complexity while maintaining analytical power. Data Views can then transform these action_name values into specific metrics or dimensions as needed. This approach offers several advantages: it simplifies data collection, makes schema maintenance more manageable, enables retroactive creation of new metrics without requiring implementation changes, and provides greater flexibility in how interactions are categorized and analyzed across different team-specific Data Views. By leveraging Data Views' transformation capabilities, organizations can maintain a leaner, more adaptable implementation that evolves with changing analytical needs without constant technical revisions.
Each Data View can be configured with unique settings while drawing from the same underlying Connection data, enabling specialized views that serve different business needs. The diagram below illustrates the CJA data architecture, showing how raw source data flows from AEP to CJA and becomes accessible in Analysis Workspaces. Data Views serve as the critical configuration layer that transforms raw connected data into business-relevant components customized for different teams and use cases.
Beyond creating team-specific Data Views, organizations can strengthen consistency and governance through Shared Metrics & Dimensions. This feature offers a centralized hub for managing components that work across multiple Data Views based on the same Connection, ensuring standardization while cutting down maintenance work.
This capability proves especially valuable for organizations implementing the specialized Data View approach outlined below, as it empowers teams to establish and maintain common core metrics and dimensions that remain consistent across the organization while simultaneously providing the flexibility to customize and tailor their analytical experience to address specific business needs, departmental requirements, and unique use cases without sacrificing standardization or governance.
Understanding the Data Views Interface
The Data Views interface in CJA consists of several key areas that provide control over how your data is structured, presented, and interpreted by end users. Each section of the interface serves a specific purpose in transforming raw datasets into meaningful, business-relevant analytics components that align with different team needs and use cases:
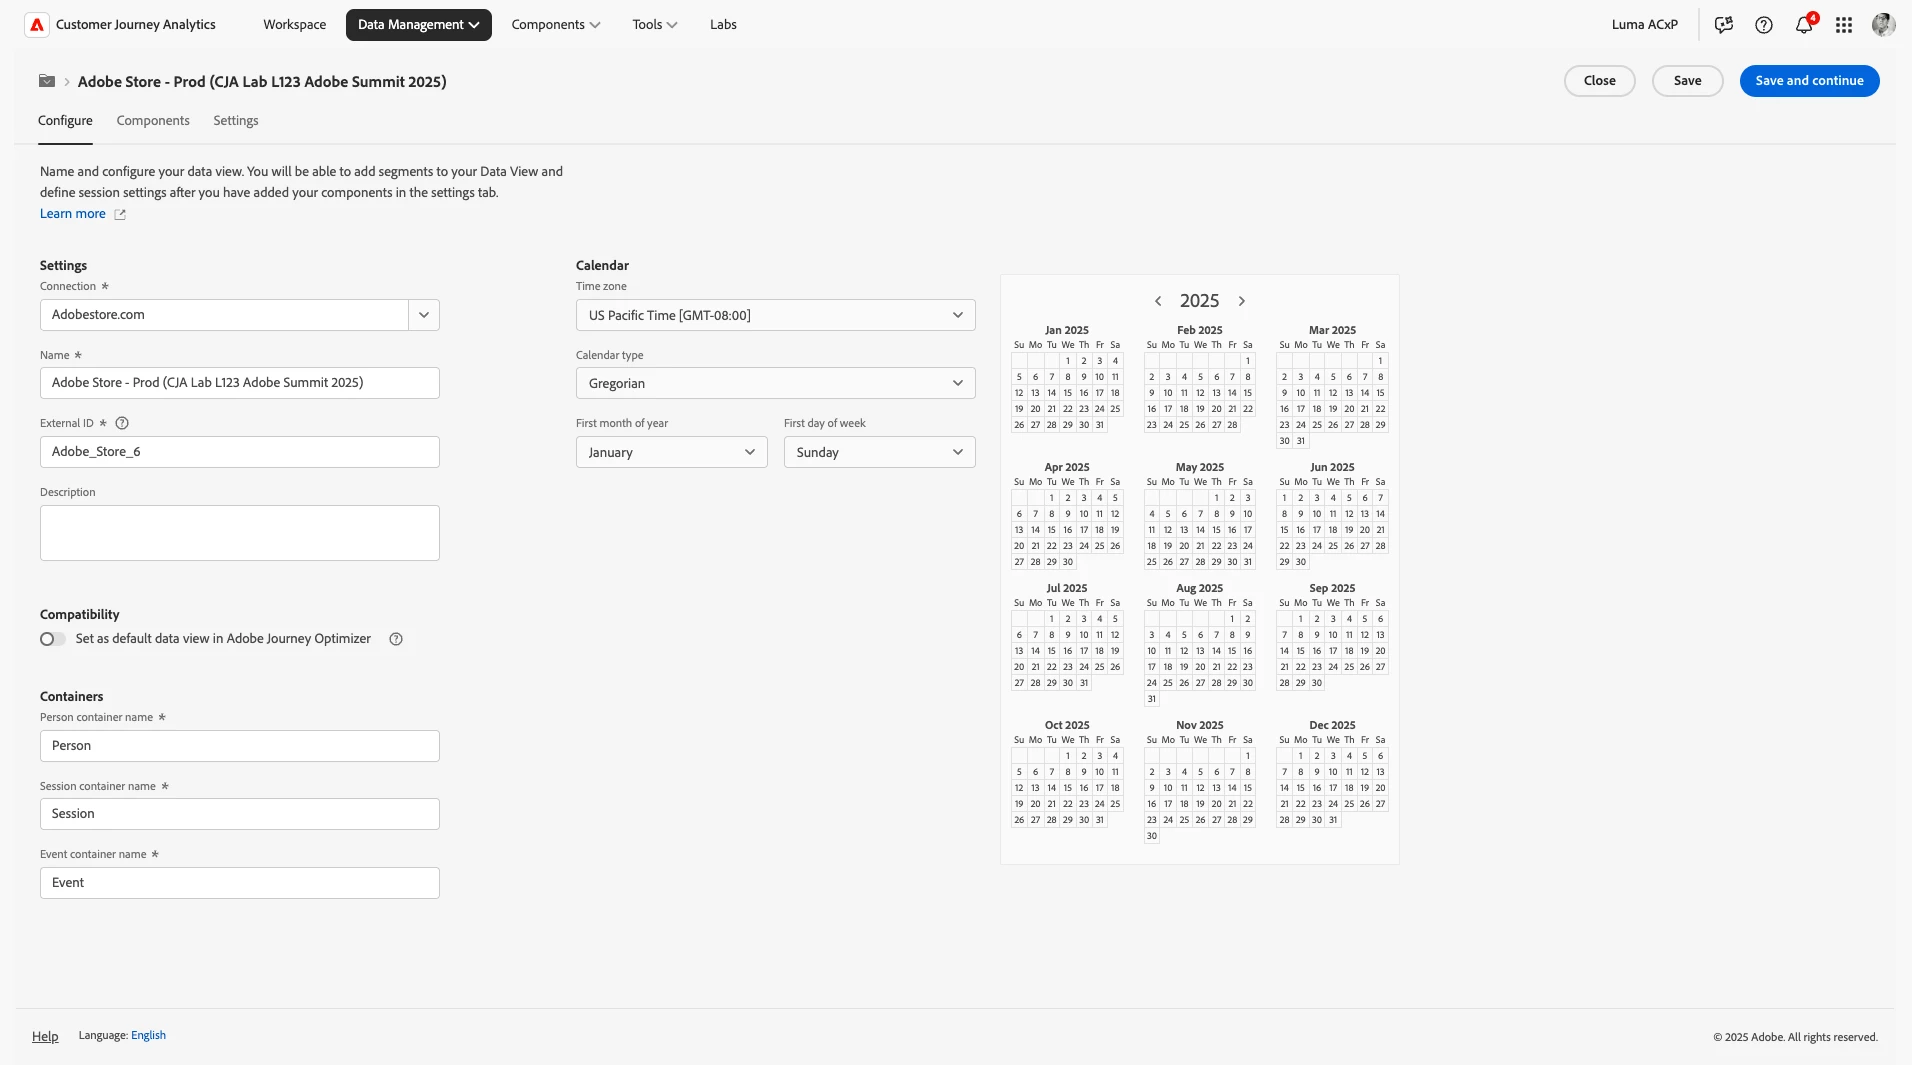
- Configure Tab: Where you establish the fundamental characteristics of your Data View, including assigning a descriptive name and description, specifying the Connection source from which data will be drawn, customizing Container names to reflect your business terminology (such as renaming "Person" to "Customer"), and selecting an appropriate base Calendar type that aligns with your organization's reporting periods and business cycles.
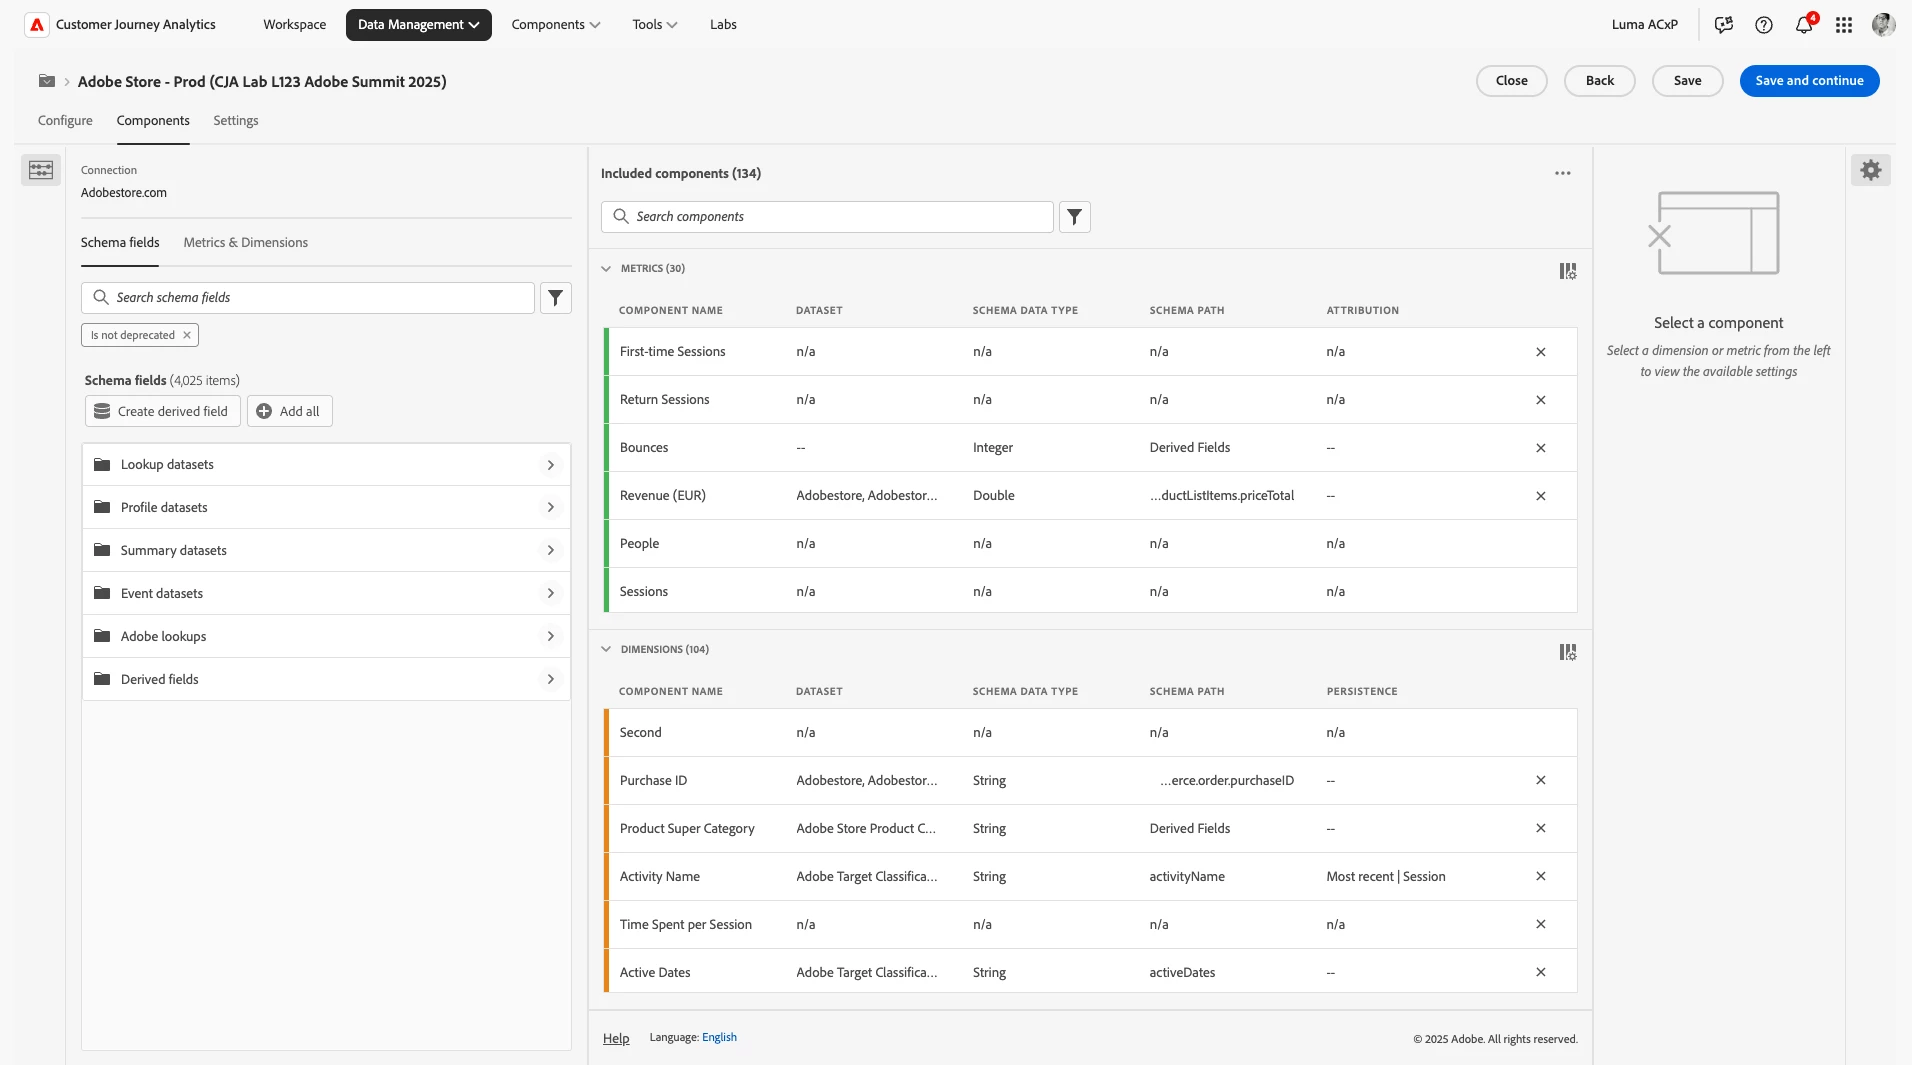
- Components Tab: Where you select, configure, and customize dimensions and metrics from source datasets, allowing you to transform raw data elements into business-relevant analytics components. This area enables administrators to rename technical field names into business-friendly terminology, apply specific attribution models to individual metrics, establish value groupings through classification rules, and determine persistence settings that define how dimension values are carried forward across user interactions.
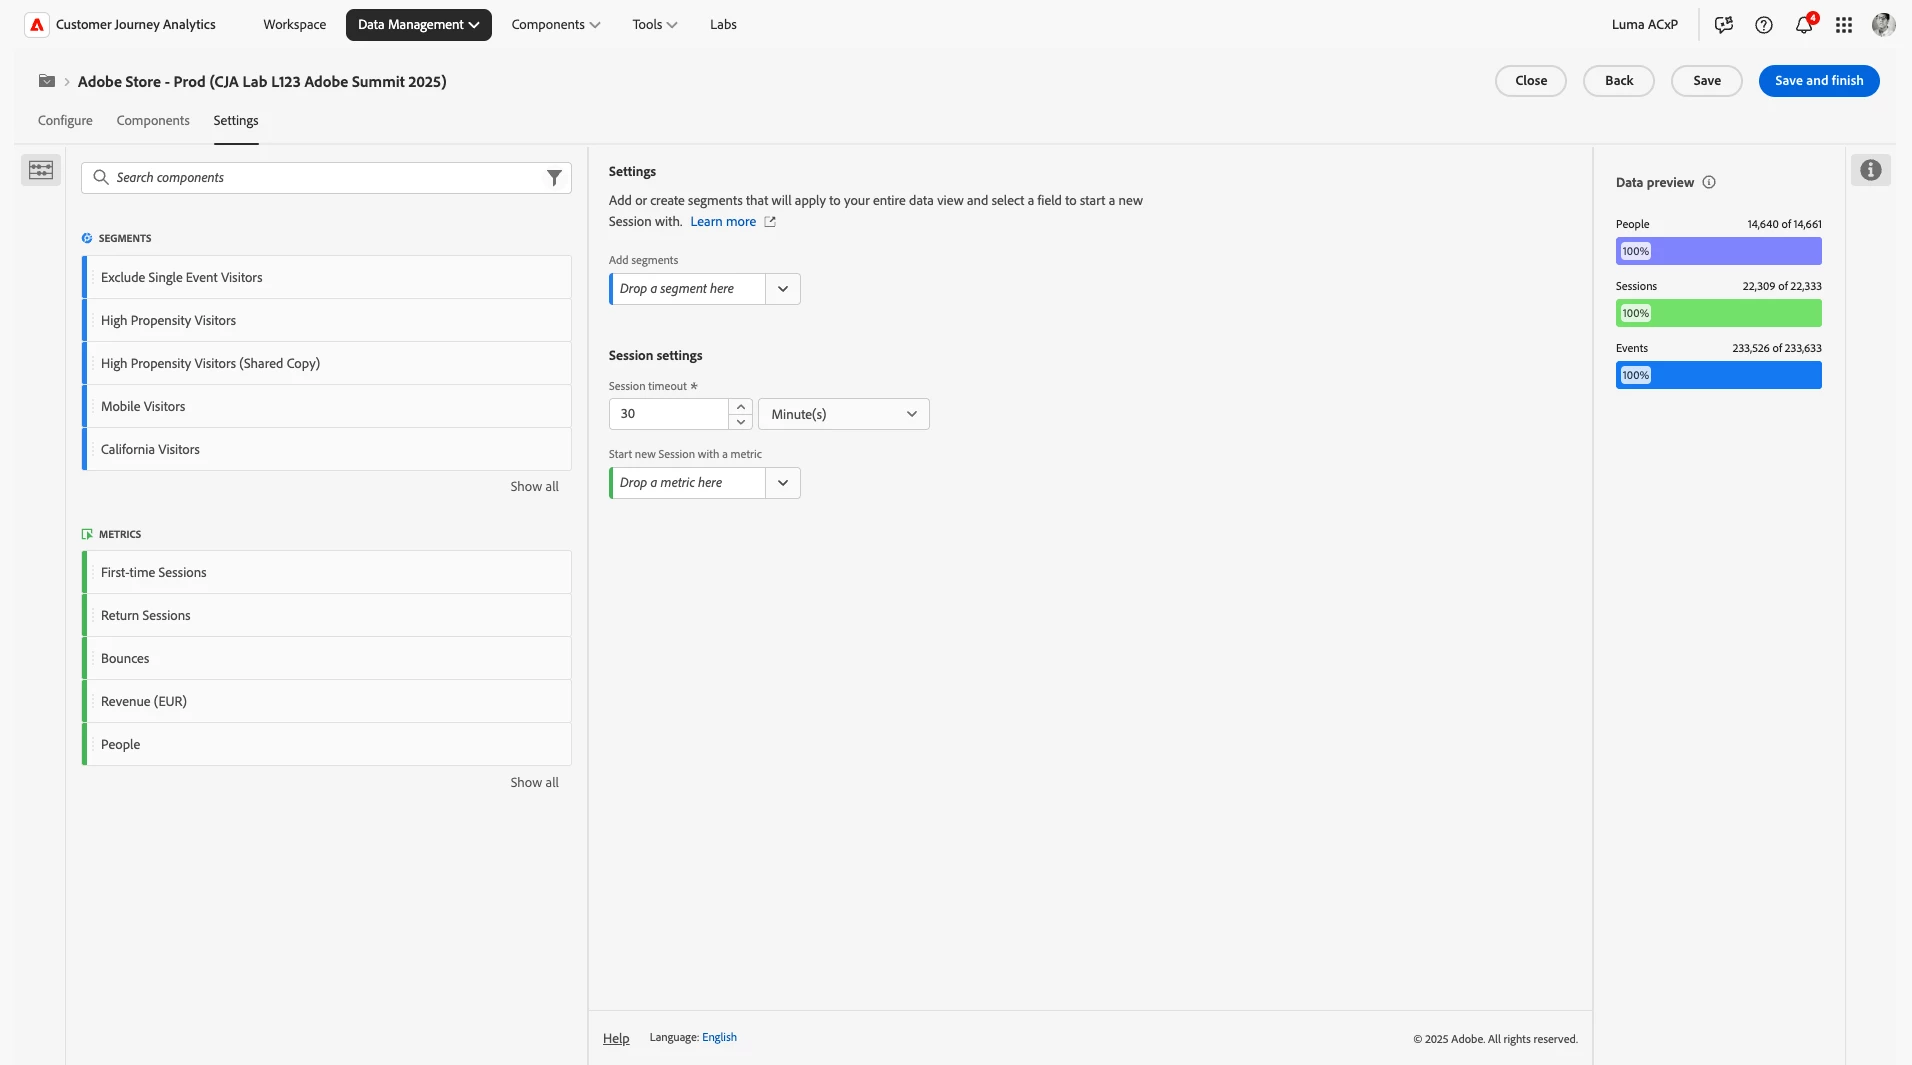
- Settings Tab: Where you define global view settings that apply across the entire Data View, including session timeout parameters and segment settings. Any segment defined here is automatically applied to all reports you run in Workspace.
Case Studies: Specialized Data View Implementations Across Different Teams
The following case studies illustrate how organizations have successfully implemented specialized Data Views to address the unique analytical needs of different departments. Each example demonstrates how thoughtful configuration choices can transform raw data into actionable insights tailored to specific business objectives. By examining these applications, you'll gain practical strategies for designing Data Views that deliver maximum value to diverse stakeholders while maintaining data consistency and governance across your organization.
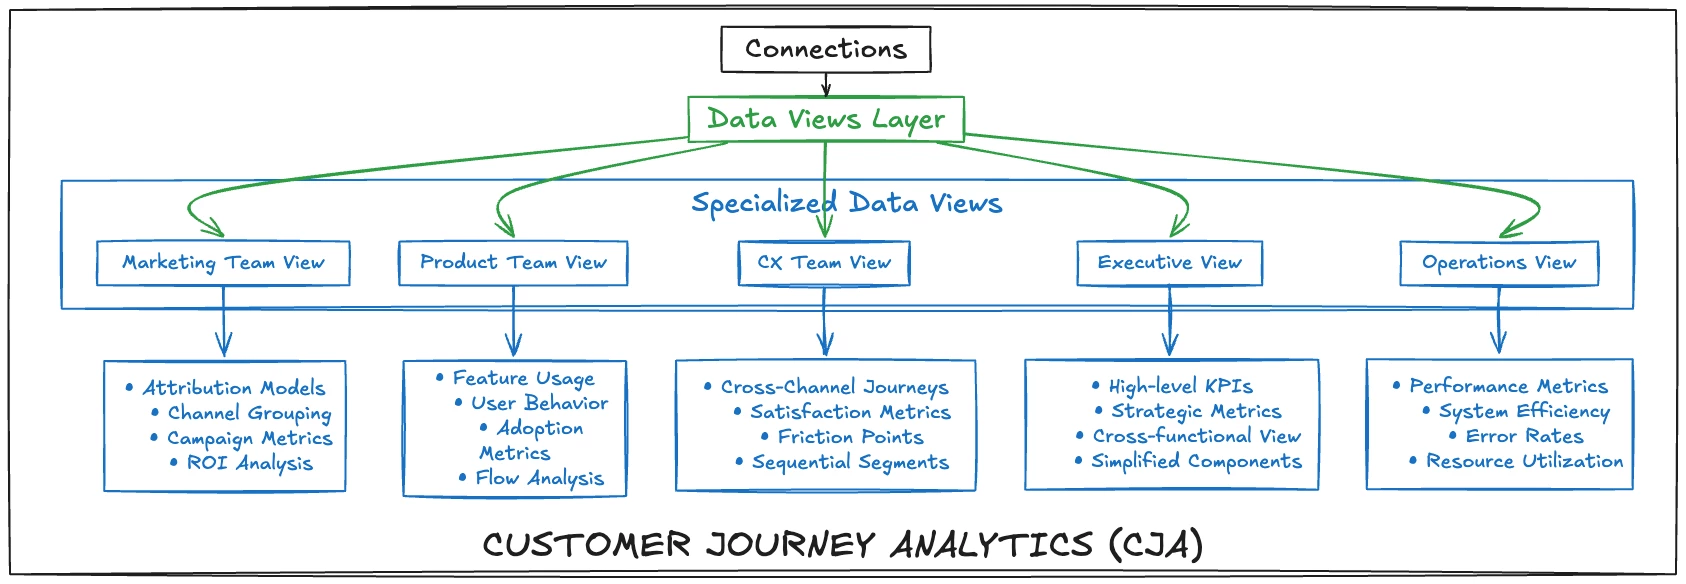
The above diagram illustrates how CJA transforms raw data from AEP into specialized Data Views tailored for different teams. Each Data View is configured with specific components, metrics, and settings that address the unique analytical needs of marketing, product, customer experience, executive, and operations teams while maintaining a single source of truth for customer journey data.
Case Study 1: Marketing Team Data Views
Marketing teams typically focus on campaign attribution, channel performance, and conversion metrics that provide insights into ROI and customer acquisition effectiveness. Their analytical needs center around understanding which marketing touchpoints influence purchase decisions, how different channels contribute to the customer journey, and which campaigns deliver the best results across various segments. When configuring Data Views for marketing stakeholders, consider the following implementation approaches that will help transform raw interaction data into meaningful marketing intelligence while maintaining the flexibility to adapt to changing campaign strategies and attribution methodologies:
Key Configuration Elements
- Attribution Settings: Configure marketing-centric attribution models (first touch, last touch, algorithmic) for campaign dimensions to properly credit marketing efforts
- Channel Grouping: Create derived fields that consolidate granular traffic sources into meaningful marketing channels
- Calculated Metrics: Implement ROI and efficiency metrics such as Cost Per Acquisition, Return On Ad Spend (ROAS), and Marketing-Attributed Revenue
- Persistence Settings: Configure longer persistence for campaign identifiers to capture the full impact of marketing activities
Implementation Example
A global retail organization configured a marketing-specific Data View by implementing derived fields that normalized campaign tracking codes across different implementations. They created calculated metrics for cross-channel attribution that were unavailable in traditional siloed analytics. By customizing dimension persistence settings to reflect their 30-day attribution window, they provided marketing teams with accurate campaign performance insights regardless of user session patterns.
Case Study 2: Product Team Data Views
Product teams need detailed insights into user interactions with their applications, feature adoption rates, and potential experience issues. They must analyze user behavior patterns, track feature engagement, monitor journeys across application components, and evaluate product enhancement effectiveness. Understanding session duration, interaction sequences, and drop-off points helps prioritize product development and identify optimization opportunities. When creating Data Views for product teams, focus on:
Key Configuration Elements
- Feature-Based Dimensions: Surface product interactions and feature usage patterns through component curation
- User Flow Metrics: Create calculated metrics around completion rates, time-to-task, and feature adoption
- Session Settings: Configure shorter session timeouts to accurately capture in-product user journeys
- Behavioral Analytics: Prioritize dimensions and metrics that reveal user behavior patterns, feature usage frequency, and adoption trends over time
Implementation Example
A SaaS company created a product-focused Data View that transformed generic event data into product-specific dimensions through derived fields and component curation. They implemented calculated metrics tracking feature adoption rates over time and user efficiency metrics that measured task completion. By restricting the view to only product-relevant components, they simplified analysis for product managers who previously struggled with complex, marketing-oriented analytics interfaces.
Case Study 3: Customer Experience Team Data Views
Customer Experience (CX) teams need comprehensive visibility into customer journeys across multiple touchpoints and channels to effectively understand user behavior patterns, identify potential friction points throughout the customer lifecycle, and accurately measure satisfaction levels at various stages of engagement. Their analytical requirements typically center around holistic journey mapping, cross-channel attribution, sentiment analysis, and identifying opportunities for experience optimization. When designing Data Views specifically for Customer Experience professionals, their interface should prioritize components that enable seamless journey visualization, friction point identification, and satisfaction measurement across both digital and offline interactions. The configuration of these specialized Data Views should prioritize:
Key Configuration Elements
- Cross-Channel Journey Dimensions: Surface touchpoint sequences across digital and offline interactions
- Satisfaction Metrics: Configure calculated metrics for NPS, CSAT, and custom satisfaction scores
- Segment Settings: Implement sequential segments that identify potential journey friction points
- Attribution Models: Apply participation-based attribution to understand touchpoint impact on overall satisfaction
Implementation Example
A telecommunications provider created a CX-focused Data View that combined web, app, call center, and retail store interactions. They implemented derived fields that standardized status indicators across systems and created journey-based calculated metrics that identified friction points. By configuring session and person containers appropriately, they enabled CX teams to analyze both micro-interactions and longitudinal customer journeys within the same workspace.
Case Study 4: Executive Leadership Data Views
Executive leadership teams require comprehensive, high-level insights that provide a holistic view of business performance across departments without getting lost in granular details. These stakeholders need access to strategic metrics that align with financial reporting cycles, corporate objectives, and key performance indicators that span multiple business functions. Their analytical needs typically center around identifying trends, tracking progress against strategic goals, and making informed decisions about resource allocation and business direction. When configuring Data Views specifically for executive teams, focus on delivering clear, actionable intelligence that connects operational metrics to business outcomes while maintaining the appropriate level of abstraction. Their Data Views should focus on:
Key Configuration Elements
- KPI-Focused Metrics: Implement calculated metrics that align with financial reporting and strategic objectives
- Cross-Functional Dimensions: Create aggregated views that bridge departmental data silos
- Time Comparison Settings: Configure year-over-year and quarter-over-quarter comparisons as default attribution models
- Simplified Component Set: Curate a focused set of dimensions and metrics that provide strategic insights without overwhelming detail
Implementation Example
A financial services institution created an executive Data View that transformed granular customer interaction data into strategic business metrics. They implemented calculated KPIs that connected digital engagement to financial outcomes and created simplified dimension sets that highlighted market trends without exposing unnecessary operational details. By configuring attribution models to support business reporting cycles, they enabled executives to track performance against strategic goals and make data-informed decisions about resource allocation and growth initiatives.
Case Study 5: Operations Team Data Views
Operations teams need real-time insights into system performance, resource utilization, and process efficiency to ensure smooth functioning of technical infrastructure and business processes. These teams are responsible for maintaining operational continuity, troubleshooting technical issues, and optimizing resource allocation across the organization's systems and platforms. They require detailed visibility into performance metrics, error rates, and throughput statistics to proactively identify potential issues before they impact end users or business operations. When designing Data Views specifically for operations teams, the configuration should prioritize technical performance indicators, system health metrics, and process efficiency measurements that enable rapid identification of anomalies and bottlenecks. Their Data Views should emphasize:
Key Configuration Elements
- Performance Metrics: Configure technical KPIs focused on system efficiency, error rates, and operational throughput
- Time-Based Dimensions: Implement granular time dimensions that support detailed trend analysis and anomaly detection
- Filter Controls: Create pre-configured filters for common operational scenarios and troubleshooting workflows
- Alert Thresholds: Set up notification thresholds for critical operational metrics that trigger automated alerts when systems perform outside acceptable parameters
Implementation Example
A healthcare technology provider developed an operations-focused Data View that transformed patient journey data into system performance metrics. They implemented derived fields that standardized error codes across platforms and created calculated metrics for system response times and process completion rates. By configuring dimensions with appropriate operational context and implementing specialized calculated metrics for queue management, they enabled operations teams to proactively identify bottlenecks and optimize resource allocation across their service delivery network.
Conclusion
Effectively configured Data Views represent a strategic advantage for organizations implementing CJA. By tailoring data presentations to the specific needs of marketing, product, and CX teams, organizations can democratize analytics while maintaining data governance and consistency. For example, a company maintains a core set of shared metrics and dimensions across all departmental views including declared customer identifiers, revenue metrics, and basic engagement KPIs, ensuring consistent reporting of fundamental business metrics. However, when they launched a new mobile app that required specialized in-app engagement tracking, they created a dedicated Data View rather than cluttering existing views with app-specific components. This approach allowed them to maintain clean, focused analytics interfaces for each team while preserving their single source of truth for customer data.
The case studies and implementation strategies outlined in this post demonstrate the power of thoughtful Data View configuration by transforming complex multi-channel data into focused, actionable insights for diverse stakeholders. Advanced settings like component curation, calculated metrics, and derived fields extend these capabilities further, allowing for sophisticated analytics without requiring changes to underlying data collection.
As you implement specialized Data Views in your organization, remember that the goal is not just technical optimization but business alignment. Engage stakeholders in the configuration process, understand their analytical needs, and iteratively refine your Data Views to deliver maximum value. With this approach, your CJA implementation can evolve from a technical tool to a strategic business asset by providing each team the insights they need in the language they understand.