
Building Your Adobe Customer Journey Analytics Foundation: A Decision Framework for Connections and Data Views
Introduction
Organizations using Adobe Customer Journey Analytics (CJA) need to clearly understand when to create new Connections versus Data Views for analytical success. This framework examines the differences between these two foundational CJA layers and provides guidance on when to use each approach. By following these principles, organizations can build an efficient, scalable analytics foundation that delivers richer insights while managing costs effectively.
Think of the CJA framework like building a house. Connections are similar to the foundation and structural framework because they determine what materials (datasets) you use, how rooms connect, and the overall integrity of the building. Data Views are like different interior designs and room arrangements within that same structure because they don't change the foundation but offer different ways to experience and utilize the space. Just as you wouldn't rebuild your house's foundation to redecorate a room, you shouldn't create new Connections when simply instantiating a Data View would suffice. However, just as you would need a new foundation to build on different terrain or with entirely different materials, new Connections are necessary when fundamentally changing what data you're analyzing or how it's structured.
Let's review practical implementation considerations and real-world applications of these CJA foundation principles. The following sections will walk you through specific examples and common scenarios to help you navigate the Connection versus Data View decision process, offering actionable frameworks you can apply directly to your own CJA implementation. As covered in A Guide to Excelling as an Adobe Customer Journey Analytics Administrator, these decisions typically fall within the administrative purview of CJA administrators who are responsible for establishing and maintaining the organization's analytics foundation.
What is a Connection?
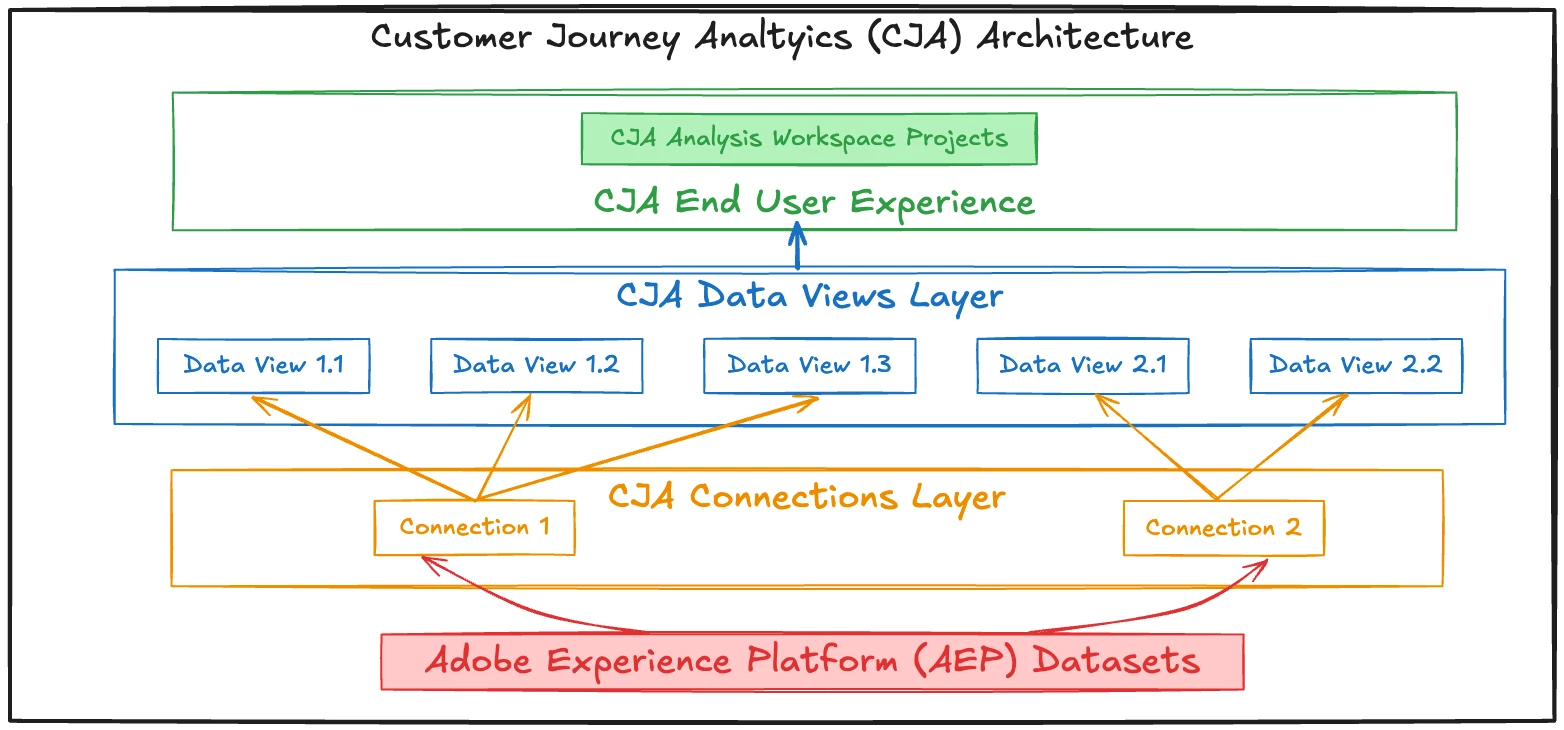
A Connection in CJA is a foundational layer that unifies one or more Adobe Experience Platform (AEP) datasets (event, profile, lookup, summary) into a single comprehensive data layer for analysis. Serving as the essential "data pipe" between AEP and CJA, Connections establish the crucial infrastructure that determines how your organization's AEP data flows into CJA. Connections play a vital role in controlling several critical aspects of your CJA foundation, including:
- Establishes which datasets from AEP will be used in CJA and determines how these datasets are unified (cross-channel, cross-device, etc.) using a common person identifier
- Primary identity fields that link person identifiers across datasets, where each dataset in a Connection must define its primary identity field to enable cross-dataset data unification.
- Session logic (e.g., defining a session by unioning events based on a person ID across datasets) is currently determined when you create the Connection. This logic controls how data is combined and how sessions are calculated
- Data retention settings control how long your data is stored while backfill options enable historical data ingestion, ensuring reporting continuity when creating or modifying Connections
- Lookup & Metadata mappings enable you to connect IDs (such as product codes) to descriptive metadata within the Connection for enhanced reporting through dynamic enrichment
What is a Data View?
A Data View is a sophisticated "lens" or configuration layer that sits on top of a Connection, offering customizable visualization and analysis capabilities without altering the underlying data structure. Data Views function as virtual interpretations of your connection data, allowing you to tailor how information appears to different user groups and business contexts. By creating multiple Data Views on a single Connection, you can deliver specialized analytics experiences that address diverse stakeholder needs while maintaining data consistency. Data views enable you to:
- Set a session settings timeout definition and configure default time zone settings at the Data View level
- Define custom calendar settings (e.g., retail or fiscal calendars)
- Apply Data View-level data filters (such as showing only one market, brand, or segment). Keep in mind that current Data View filter logic only restricts what data appears in your reports and analyses. It doesn't change how session data is determined or connected at the Connection level.
- Curate which component dimensions and metrics are exposed to end users in Analysis Workspace
- Create derived fields for specific analysis needs, but be aware that derived fields are applied at the Connection level. This means any changes made to a derived field in one Data View will automatically be reflected in all associated Data Views within the same Connection.
- Create and manage custom persistence and attribution settings for components
- Configure component formatting, value groupings, classification, and parsing options
- Setup and manage component visibility (who can see what components)
- Enables management of Shared Metrics & Dimensions across multiple Data Views
- Data Views derived from Field-based Stitching (FBS) and Graph-based Stitching (GBS) Connections deliver enhanced person-based analysis, improving cross-channel attribution and cohorting capabilities.
Connection vs. Data View: Key Distinctions
Let's compare the key distinctions between Connections and Data Views to solidify your understanding of when to use each component. The following matrix highlights the fundamental differences between these two layers of CJA, reinforcing the decision framework we've established. Understanding these distinctions will help you make more informed architectural choices that balance analytical flexibility with resource optimization.
| Characteristic | Connections | Data Views |
|---|---|---|
| Purpose | Foundation layer that unifies datasets | Configuration layer that interprets Connection data |
| Impact on Data | Determines what data is available and physically creates "material" (i.e., indexed copy) | Controls how data is presented and interpreted, but does not create additional physical storage or "material" (i.e., indexed copy) |
| Licensing Implications | Directly affects data row usage and licensing costs | No additional cost impact regardless of how many you create, staying within CJA product license constraints |
| Technical Complexity | Higher - requires careful planning | Lower - can be modified without affecting foundation |
| Flexibility | Less flexible - fundamental changes require new Connections | Highly flexible - multiple Data Views can serve different needs |
| Primary Controls | Dataset inclusion, identity declaration, identity stitching, data retention and backfill, sessionization calculations | Session timeout configuration, base calendar basis, persistence and attribution, metrics, dimensions, indirect curation of segments and calculated metrics, and derived fields |
| Typical Use Cases | New data sources, identity framework changes | Different team views, analysis approaches, filtering use cases |
When to Create a New Connection
Create a new Connection when you need to:
- Integrate fundamentally different datasets: Onboarding data from a new application, channel, brand, or business unit that isn't present in or suitable for inclusion in any existing Connection.
- Change how data connects across datasets or people: For instance, when you want to use a different identifier field, or you need to combine datasets using new person identifiers or join keys.
- Manage data row usage for licensing and cost efficiency: Since licensed rows are calculated at the Connection level, carefully evaluate all dataset additions to the Connections layer in terms of their impact on your licensed row consumption.
- Perform cross-functional separation: When teams need strict separation or access control over their data, distinct Connections make sense.
- Test or validate new data sources: Creating a separate Connection lets you pilot, QA, or validate new data integrations without disrupting your production data flows.
- Migrate or refactor existing integrations: When you're moving from older data pipelines to new architectures, a separate Connection helps avoid conflicts with your current data processing or reporting.
- Handle compliance or privacy requirements: Sometimes regulatory, legal, or privacy mandates require isolating specific datasets in their own dedicated Connection.
- Analyze entirely new sandboxes (e.g. dev, test, staging, prod): CJA Connections are sandbox-specific, so you'll need separate Connections for data sources from different sandboxes.
When to Create a New Data View
Create a new Data View when you want to:
- Provide tailored reporting for different teams/users: Create specialized views for different geographies, business units, or analyst personas.
- Show filtered data subsets: Display only specific countries, product lines, or customer segments using built-in filters or derived fields.
- Apply different analysis settings: Customize component-level persistence, attribution models, session timeouts, time zones, or journey segmentation rules.
- Experiment with temporary configurations: Create Data Views freely for learning or testing without affecting licensing costs or system performance.
- Curate component visibility: Show or hide dimensions, metrics, derived fields, calculated metrics, or segments for particular user groups.
- Test new metrics or field configurations: Try different persistence and attribution settings without altering the underlying data schema or exposing these changes to the broader user base.
- Restrict data visibility for compliance: Present only approved components to specific groups or roles, improving governance.
- Create dedicated experimentation reporting setups: Enable targeted analysis of experiments without disrupting primary experiment reporting Data Views.
- Support phased feature rollouts: Give early adopters access to new fields or settings in separate Data Views before global release.
- Accommodate different business calendars: Apply customized calendar date ranges that align with specific reporting needs.
- Align with external reporting needs: Mirror the reporting structure or granularity required by partners, vendors, or external stakeholders.
Decision Framework
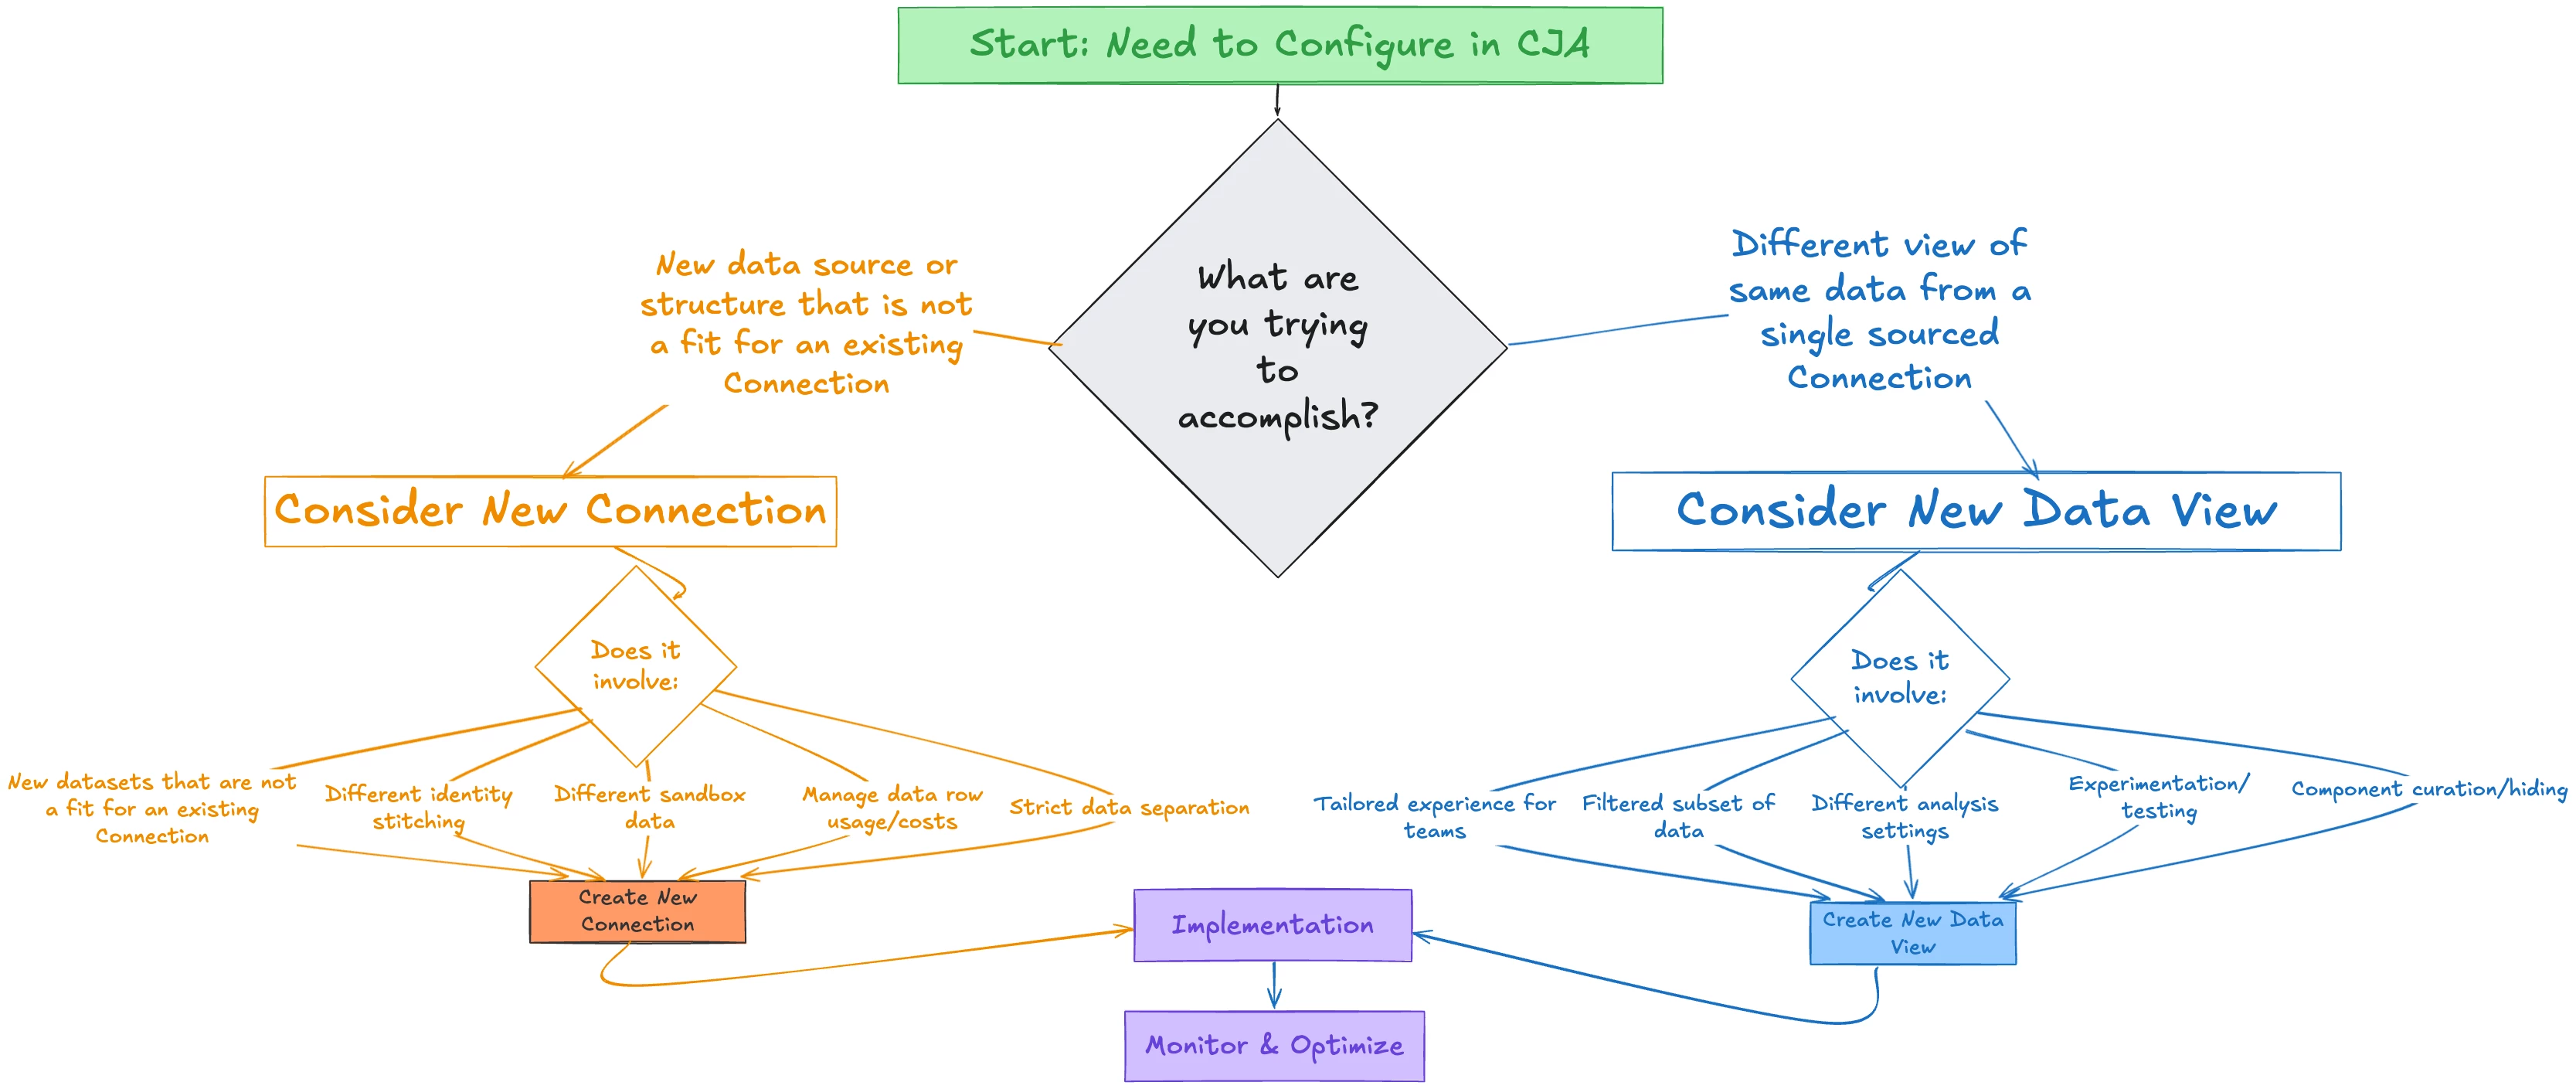
The diagram below illustrates the decision-making process for determining whether to create a new Connection or a new Data View in Customer Journey Analytics. This framework helps organizations optimize their CJA implementation by making strategic choices about their data architecture.
Connection Path (Orange)
Follow the Connection path when you need fundamental changes to your data foundation, such as incorporating new AEP datasets that don't fit into existing Connections, changing identity declaration or stitching methods, working with different sandbox environments, or managing your licensed row usage costs.
Data View Path (Blue)
Choose the Data View path when you need different perspectives or configurations of the same underlying data, such as creating tailored experiences for different teams, filtering data subsets, applying different analysis settings, or experimenting with new configurations without impacting the data foundation.
This framework ensures that organizations make cost-effective, efficient decisions that align with their analytics goals while maintaining data consistency and governance across the enterprise.
Key Takeaways and Best Practices
Making the right choice between creating a new Connection or Data View is essential for optimizing your CJA implementation and adhering to CJA Guardrails. Here are some final considerations to guide your decision:
- Start with a clear data strategy: Before creating Connection or Data View layers, map out your data requirements, stakeholder needs, and analysis objectives.
- Favor Data Views when possible: Since they don't impact licensing costs and offer tremendous flexibility, use Data Views liberally for different analytical perspectives.
- Be strategic with Connections: Since Connections directly impact data processing and licensing costs, only create new ones when you have a fundamental need for different dataset combinations, dataset separation, core sessionization logic, or identity handling.
- Document your architecture: Maintain clear documentation of your Connections and Data Views to ensure governance and facilitate knowledge sharing across teams.
- Regular review and optimization: Periodically assess your Connection and Data View configurations to ensure they continue to meet business requirements as your organization evolves.
- Balance flexibility with governance: While Data Views offer flexibility, establish governance guidelines to prevent the proliferation of redundant or confusing Data Views. Utilize Shared Metrics & Dimensions administrative management to maintain cross-Data View alignment where possible.
- Monitor and clean up redundant assets: Implement a regular audit process to identify and archive or retire unused or obsolete Connections and Data Views to maintain a streamlined environment.
- Invest in user training: Create documentation that clearly explains each Data View's purpose, its applicable underlying filters, and its intended user groups. Hold regular training sessions to showcase how different Data Views address specific analytical requirements.
- Establish feedback mechanisms: Create structured processes to gather user feedback on existing Connections and Data Views to continuously refine and optimize your analytics foundation.
- Stay informed about product enhancements: Regularly review Adobe's CJA release notes and participate in community events and forums to understand new capabilities for Connections and Data Views that may influence your implementation strategy.
Remember, mastering the strategic use of Connections and Data Views in CJA is an ongoing endeavor. By thoughtfully applying these guidelines, you'll create a more efficient, cost-effective, and powerful analytics ecosystem that delivers richer insights across your organization. As you continue to evolve your CJA implementation, regularly reassess your Connection and Data View strategy to ensure it aligns with your changing business requirements and analytics objectives.
Conclusion
CJA stands as a powerful solution for organizations seeking to unlock deeper insights from their customer data. By understanding the fundamental differences between Connections and Data Views, and by applying the decision framework outlined in this post, you can build a CJA foundation that is both robust and flexible.
Remember that Connections form the bedrock of your data infrastructure, bringing together disparate AEP datasets into a cohesive whole, while Data Views provide the interpretive lens through which your teams can extract meaningful insights tailored to their specific needs.
As you continue your CJA journey, don't be afraid to experiment with new Data Views to explore different analytical perspectives, but remain strategic about when to create new Connections. By balancing these layers effectively, you'll not only optimize your analytics investment but also empower your organization to make more informed, customer-centric decisions that drive business success.
The art of CJA implementation goes beyond simple technical configuration. It's about creating a dynamic analytics ecosystem that grows with your business, sheds light on customer journeys across all touchpoints, and reveals valuable insights that were previously hidden in your data. When you thoughtfully balance Connections and Data Views using this decision framework, you'll build an analytics foundation that provides both depth and flexibility.