
A Guide to Understanding and Utilizing Customer Journey Analytics Data Views
Introduction
Understanding Data Views is pivotal to getting the most out of your Adobe Experience Platform analytics data. In this guide, we will discuss the basics of Customer Journey Analytics (CJA) data views setup and how they can benefit your company. In a follow-up blog post, "A Guide to Customer Journey Analytics Data View Component & Global Filter Settings”, we will continue building on this foundation. We will explore more advanced topics in further depth, such as configuring data view-level schema to granular components settings and data view-wide global filter settings. With this combined knowledge, you will be well-equipped to harness the full power of your Customer Journey Analytics data to drive your business forward.
What are Data Views?
A data view is a customized view of your Customer Journey Analytics data. It allows you to filter, compose, and organize your data to gain deeper insights into your company’s data and users. With data views, you can create custom views that focus on specific metrics, dimensions, and filters, giving you a tuned and precise understanding of your platform’s user behavior.
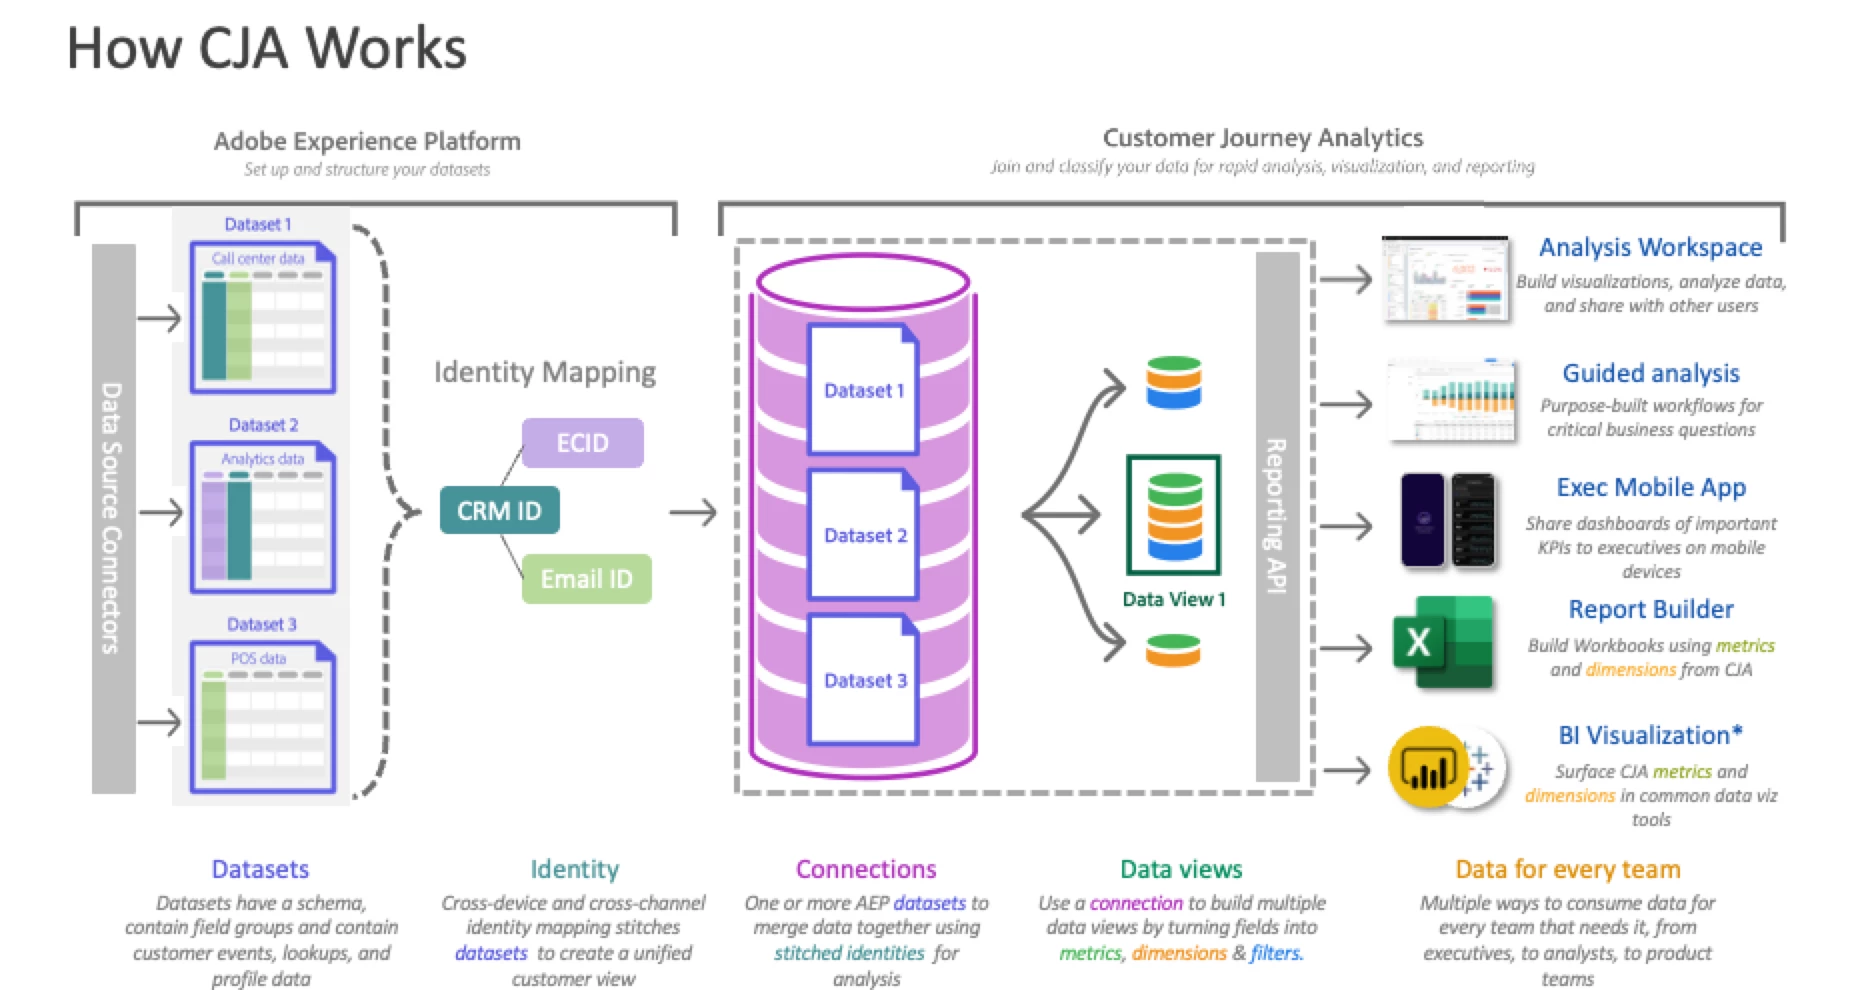
How to Create a Data View
To create a data view, you must have the appropriate set of permissions within your Adobe Admin Console. Once you have access, log in to Customer Journey Analytics and select the "Data Views" tab. From there, you can create a new data view by selecting "Create new data view" and following the prompts. The base configuration settings establishes a Connection to one or more Adobe Experience Platform datasets along with the name of the given Data View and Description. You can also optionally customize the names of your Person, Session, or Event Containers and adjust base calendar format and type settings.
Benefits of Data Views
Data views allow you to focus on specific metrics and dimensions that are most relevant to your company curated from the available Adobe Experience Platform datasets. This can save you time and help you make more informed decisions in reporting and analysis efforts. Additionally, data views can help you identify trends and patterns in your data that you may have missed otherwise. By upfront curation of your data, you can gain a deeper understanding of your users and how they interact with your platforms. Finally, data views help you share insights with stakeholders by enabling creation of custom projects that are easier to rationalize and interpret.
How to Approach Customer Journey Analytics Data Views
Here are some tips on how to use Customer Journey Analytics data views effectively:
1. Define Your Objectives
Before you start analyzing your data, it is important to clearly define and articulate your objectives. Ask yourself what specific questions you want to answer with your data, and how those answers will help you shape your business goals and strategy. This will not only help you determine which metrics, dimensions, and filters to focus on in your data view, but also ensure that you are onboarding the needed and right Adobe Experience Platform datasets in order to make informed decisions. By setting clear objectives, you can also better understand the context of the data and how it fits into the larger picture of your business operations and platforms, leading to more comprehensive and valuable insights.
2. Customize Your Components
One of the biggest benefits of data views is the ability to create highly customized Components on a retroactive and non-destructive for-all-time basis. This means that you can easily go back and make changes to your data view configuration as needed, without having to start from scratch. When creating your data view, it's important to focus on the metrics and dimensions that are most relevant to your objectives.
In addition to selecting relevant metrics and dimensions, it's also important to ensure that they are of the appropriate data types and that attribution or persistence settings are aligned with your company's standards. For example, if your company has a specific way of tracking customer behavior or attribution credit, it's important to ensure that your metrics and dimensions are set up in a way that aligns with this standard. This will help ensure consistency across different data views and make it easier to compare and analyze data over time.
By taking the time to create a well-designed data view that includes relevant metrics and dimensions, you can gain a deeper understanding of customer behavior, identify trends, and make more informed business decisions. Take advantage of the data view capabilities to experiment and try out different combinations of metrics and dimensions along with associated component settings until you find the ones that work best for your business.
3. Filter Your Data View
Filtering your data is a key component of effectively using data views. This process may involve handling duplicate data cases, configuring session timeout logic, or applying exclusion logic rules across the board within the data view. By filtering your data, you can better isolate specific groups of users and comprehensively analyze their behavior with confidence in the underlying datasets parameters. This can help you identify trends and patterns that may not be apparent when looking across all your data as a whole.
4. Share Your Data Views
After creating your data view, the next crucial step is to share the insights held within the data view with stakeholders. Use the data view as a launching pad to build reports and projects that clearly and concisely communicate your findings. Data views are a critical step in ensuring that everyone in your organization understands your company's performance from a solid foundational design. You can selectively share your data views with other team members and collaborate on analysis and insights.
5. Continuously Refine Your Data Views
Setting up data views is not a one-time process. It requires continuous refinement to keep up with the potentially ever-changing nature of upstream data sources and the evolution of your overall business. While it may seem like a daunting task at first, it is important to remember that the insights gained from well-crafted data views can be invaluable in making informed decisions that drive business success. This means that it is necessary to regularly review and update your data views as needed to ensure that they are providing you with the most accurate and up-to-date information possible. By doing so, you can be confident that you are making the best decisions for your business and taking advantage of all the latest data view functionality.
Conclusion
Customer Journey Analytics data views are an indispensable and versatile tool for gaining deeper insights into your data and platforms. By allowing you to customize your data views with the metrics and dimensions that are most relevant to your business objectives, they provide a comprehensive understanding of how your platforms are performing. With a detailed view of your company’s performance, you can identify areas for improvement and make better-informed decisions based on the underpinnings of your flexible and configurable data views. For more detailed information on the decision process regarding component settings and global filter settings in data views, please refer to the follow-up blog post, "A Guide to Customer Journey Analytics Data View Component & Global Filter Settings."