
Crafting Effective Adobe Customer Journey Analytics Data Views: Best Practices for Management and Curation
Introduction
Data Views in Adobe Customer Journey Analytics (CJA) function as powerful, customizable lenses that determine how your Adobe Experience Platform (AEP) datasets are interpreted from CJA Connections. These Data Views contain component configurations that define all dimensions and metrics available to users in Analysis Workspace and control how these components are logically structured. Unlike traditional analytics implementations where changes required extensive coding or time-consuming data reprocessing, CJA Data Views provide flexibility through retroactive, non-destructive, report-time processing capabilities thus allowing you to make adjustments without disrupting your data collection infrastructure.
Building on this foundation of Data Views functionality, this blog post explores best practices for effectively managing and thoughtfully curating your CJA Data Views. These practices will maximize operational effectiveness, ensure analytical consistency, and drive more meaningful, actionable business insights across your organization. A key advantage of Data Views is their flexibility in component management allowing you to add, remove, or modify components on the fly, and even convert metrics to dimensions or vice versa without changing the underlying data. These modifications apply immediately through report time processing, enabling you to adapt your analytical framework with just a few clicks. We'll examine strategies that technical implementers, administrators, and practitioners can use to create intuitive, well structured Data Views that accelerate time to insights in CJA.
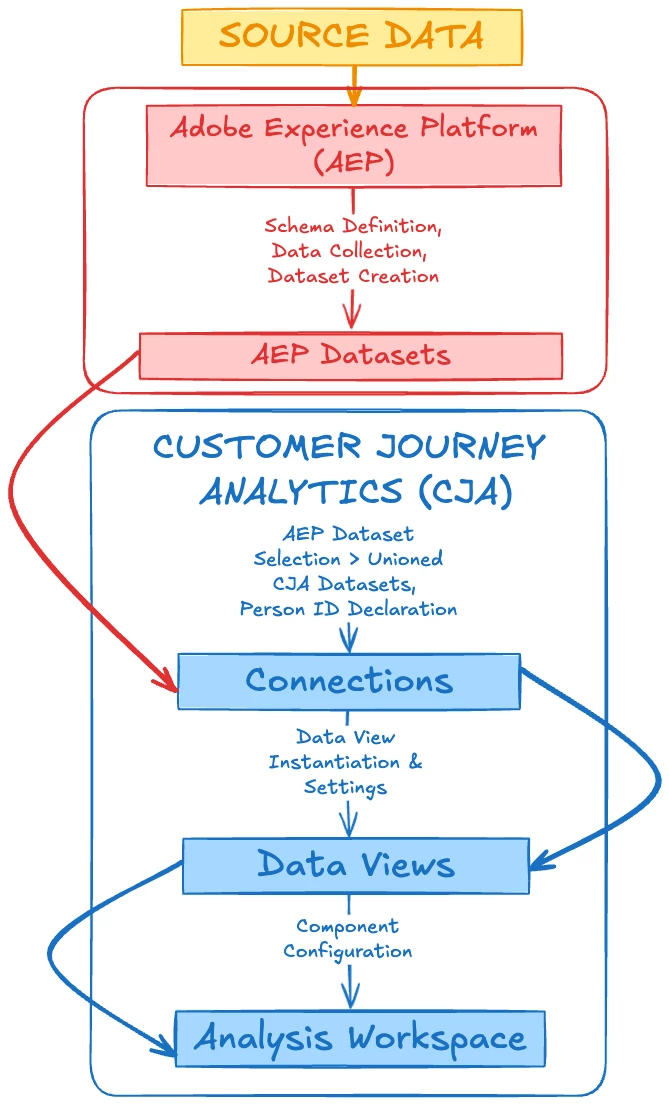
This diagram illustrates the data flow from AEP to Analysis Workspace in CJA. The process begins with schema definition and data collection in AEP, which creates datasets that are then selected and configured in CJA Connections. These Connections feed into Data Views, where components are configured to create customized lenses for viewing the data. Finally, these Data Views power Analysis Workspace, where users perform their freeform analyses.
Start With a Governance Framework
Before diving into the technical aspects of Data View curation, it's essential to establish a clear governance framework that provides structure and guidance for your organization. This foundational framework should outline and document CJA administration:
- Roles and responsibilities for Data View management
- Naming conventions and documentation standards
- Review cycles for maintaining Data View quality
- Processes for requesting new components or modifications
- Coordination and consistency mechanisms across multiple aligned Data Views
- Establish clear communication protocols to inform end users about Data View modifications, component deprecations, and newly released CJA features that affect analysis
A well-structured governance framework establishes and maintains consistency all organization Data Views and serves as a foundation for preserving data integrity throughout your organization's CJA implementation journey. By clearly defining roles, responsibilities, and processes, this framework creates a structured environment where AEP and CJA data management becomes more predictable and reliable. It facilitates smoother collaboration between technical teams and business stakeholders, ensuring everyone understands their role in maintaining high-quality data standards in CJA. Over time, this systematic approach reduces the risk of data discrepancies, improves analytical accuracy, and creates a more sustainable ecosystem for your CJA implementation.
Data View Curation Best Practices
Managing Data Views effectively is essential for maximizing the value of your CJA implementation. This section presents key practices for curating and organizing Data Views to enhance usability, maintain data integrity, and facilitate efficient analysis. Following these guidelines will help you create an intuitive CJA environment that empowers both technical and business users to extract meaningful insights while reducing confusion and redundancy.
Adopt a Minimalist Approach
Add only the dimensions, metrics, segments, and calculated metrics that your practitioners actually need and will regularly use in their analyses. A streamlined and curated component list significantly improves user experience by accelerating search functionality and eliminating confusing scenarios where analysts might encounter multiple similarly named dimensions or metrics (such as "Which 'revenue' metric should I be using for this report?"). This thoughtful curation becomes particularly critical in the CJA environment, where the flexibility to create and customize components could rapidly lead to unmanageable component proliferation if not governed properly. By maintaining discipline in your component strategy, you'll create a more intuitive analytical workspace that reduces cognitive load for users and ultimately leads to more consistent reporting across your organization. Additionally, a well-organized component structure significantly benefits Data Insights Agent for CJA, enabling the AI to provide more accurate and relevant suggestions when users leverage the "Ask in natural language" functionality.
Use Clear, Descriptive Names
Replace cryptic component names with descriptive, intuitive ones that reflect what users would naturally search for when building analyses (e.g., "Online Revenue (USD)" instead of "online_rev"). This practice significantly improves discoverability and reduces the learning curve for new analysts who may be unfamiliar with your technical implementation details or internal naming conventions. Clear, self-explanatory component names eliminate the need for analysts to constantly reference documentation or consult with implementation specialists when building reports.
Additionally, maintain vigilance against duplicate or similar naming patterns across dimensions, metrics, and segments throughout your Data View. Naming inconsistencies can create substantial confusion during analysis, potentially leading to incorrect conclusions or reporting discrepancies when users inadvertently select the wrong component. For example, having both "Customer ID" and "User ID" referring to similar but slightly different concepts can lead to misinterpretation of analysis results.
A disciplined naming convention that incorporates business terminology rather than technical jargon enhances both analytical efficiency and data governance by creating a shared vocabulary that bridges the gap between technical AEP implementation and CJA business understanding. Furthermore, aligning component naming in CJA with naming conventions used in other organizational systems creates cross-platform consistency that helps users easily correlate data across different tools in your technology ecosystem.
Leverage Component Tags
Implement a strategic tagging system for your components to enhance organization and searchability within your Data View. Component tags serve as powerful organizing tools that help users quickly filter and locate specific dimensions, metrics, segments, or calculated metrics by relevant categories. Effective tagging strategies include classifying components by business unit (Marketing, Sales, Support), data source (Web, Mobile, CRM), analysis type (Acquisition, Retention, Conversion), or reporting frequency (Daily, Weekly, Executive). When implementing tags, maintain consistent taxonomy across your CJA environment and document your tagging framework in your broader governance documentation. This approach reduces time spent searching for components, especially in complex implementations with numerous custom metrics and dimensions. Regularly review and refine your tagging structure to accommodate new analytical needs while preventing tag proliferation that could undermine the system's effectiveness.
Prioritize Essential Segments & Calculated Metrics
When building analytical reports and dashboards, it's crucial to centralize and standardize critical segments and calculated metrics. Key analytical custom components (such as segments like "Email-Campaign Sessions" or "Customers," or calculated metrics like "Revenue per Person," "Conversion Rate," or "Bounce Rate") must be explicitly shared, readily visible in the same Data View, and ideally administrator-approved via tags at the segment or calculated metric level. This standardization ensures all analysts have consistent access to these critical components, preventing situations where team members create slightly different versions of the same definitions. Without this consistency, you risk introducing analytical discrepancies that lead to conflicting insights and potentially flawed business decisions based on inconsistent data interpretations.
Balancing Approaches: Metric Override vs. Dedicated Components
When implementing metric variations in CJA, administrators must choose between metric overrides or dedicated components. While both approaches have merit, metric overrides generally provide more benefits for most scenarios. This method enables dynamic application of different attribution models without cluttering your Data View component library. By maintaining consistent core metric definitions while allowing contextual variations through overrides, you create a streamlined, manageable component list that's easier to navigate while still offering analytical flexibility. This approach is especially valuable in enterprise environments where component proliferation can quickly overwhelm users.
However, this recommendation isn't absolute as it requires careful consideration of your specific analytical needs. One of CJA's key strengths is its flexibility to accommodate various analytical approaches, including purpose-built components with customized persistence settings tailored to specific business use cases. These dedicated components prove invaluable when certain metric variations are frequently used across multiple analyses or represent standard business definitions that should be consistently applied in specific contexts.
Strategic Use of Derived Fields
Use derived fields strategically for data transformation within your Data Views. These versatile components allow you to enhance your data without complex, resource-intensive data engineering processes. With derived fields, you can combine multiple fields to create meaningful composite values, clean data by removing unwanted characters or standardizing formats, and perform supported rule-based transformations retroactively and instantly. This approach preserves your source data's integrity while reducing implementation time by enabling immediate transformations at the reporting layer instead of requiring source or AEP-side changes. The result is cleaner, more contextualized, and immediately actionable components that analysts can use for deeper insights without waiting for engineering resources or complex pipeline modifications. By implementing derived fields strategically, you create a more agile analytical environment that adapts quickly to evolving business needs while maintaining consistent data governance standards.
Establish Separate Development and Production Environments
Maintain separate Development and Production Data Views to create a controlled environment for testing and innovation without disrupting business-critical reporting. Development Data Views function as sandboxes where administrators can experiment with new components, attribution settings, and derived fields before deploying them to production. This separation protects established reporting workflows from disruption, enables thorough validation before user exposure, and facilitates smooth component rollouts.
In Production environments, only include dimensions, metrics, segments, and calculated metrics that are production-ready, validated, and ideally administrator-approved. For components still in development, either create a separate organizational group clearly labeled "Draft" or "In Development," or place them in a separate non-production Data View. This clear separation distinguishes between validated components that can be confidently used for business decisions and experimental ones that may contain unresolved issues.
Implement a formal promotion process that requires new components to meet specific quality criteria and pass stakeholder review before migrating from Development to Production. Use shared components selectively to maintain consistency between environments while allowing for independent configuration. Document all changes thoroughly, including implementation dates and business justifications, to ensure auditability across your CJA infrastructure. For additional quality assurance, consider implementing a middle-tier "QA" or "Staging" Data View with limited user access for final verification.
Shared Metrics and Dimensions Management
Consistent availability, naming conventions, and identifiers for data fields across multiple Data Views in your CJA implementation is essential. This standardization goes beyond mere organizational tidiness as it enhances the user experience by creating familiarity and predictability. Analysts can confidently apply their knowledge across different Data Views without having to relearn component meanings. This consistency allows both human users and Data Insights Agent to navigate between analytical environments without losing context or requiring adjustment. CJA provides an organizational feature through the Shared Metrics & Dimensions manager, which offers several advantages when implemented across multiple Data Views:
Cross-Data View Consistency
By using shared metrics and dimensions, you establish a unified analytical foundation that ensures consistent definitions and calculations across your entire CJA implementation. This standardization guarantees that critical business metrics maintain their integrity regardless of which Data View an analyst uses. For example, when users encounter a metric labeled "Revenue (USD)" in any Data View throughout your implementation, they can work with confidence knowing it's calculated using exactly the same methodology, attribution model, and data sources. This consistency eliminates confusion and prevents reporting discrepancies that often arise from inconsistent metric definitions.
Streamlined Maintenance
When updates or modifications become necessary, shared components provide an operational advantage by allowing administrators to implement changes in a single, centralized location that automatically propagate across corresponding Data Views utilizing that particular component. This centralized management approach reduces the administrative maintenance overhead that would otherwise be required to manually update each Data View individually. It also substantially minimizes the risk of drift inconsistencies that can arise when components with identical business purposes are defined differently across various Data Views. By ensuring that critical business definitions remain synchronized throughout CJA Data Views, shared components help maintain data integrity and reporting reliability across your entire organization.
Accelerated Onboarding
Standardized components that function consistently across all Data Views offer tremendous benefits to new analysts joining your team. This standardization significantly reduces the learning curve typically associated with complex analytics platforms, enabling team members to become proficient faster. Instead of mastering multiple variations of similar metrics or dimensions across different Data Views, analysts can learn a concept once and apply it universally. This consistency creates an intuitive analytical environment that boosts productivity, shortens training time, and reduces the frustration often experienced when learning new systems. Furthermore, standardized components foster better collaboration between new and experienced analysts, as everyone works with identical analytical building blocks regardless of which Data View they're using.
Best Practices for Shared Components
- Create a core component library: Develop a set of fundamental metrics and dimensions that can be shared across multiple Data Views
- Document shared component dependencies: Maintain clear documentation of which Data Views use which shared components to understand the impact of any changes
- Establish a review process: Before modifying shared components, review the potential impact across all dependent Data Views
- Balance sharing with customization: Not every component needs to be shared. Maintain the flexibility to create Data View-specific components when appropriate
- Use component filters effectively: Leverage available filters by component type, dataset, Data View, and creator to efficiently manage your shared component library
- Documentation and traceability: Utilize component descriptions and other component lineage metadata to provide clear information about each shared component's purpose and usage
- Monitor Connections: Remember that shared components are specific to a single Connection and cannot be shared across different Connections
- Track component usage: Regularly review which Data Views use which shared components to understand dependencies and the potential impact of changes
- Understand component limitations: Be aware that each Connection can contain up to 10,000 shared metrics and 10,000 shared dimensions
- Establish a regular review process: Use the job history feature to monitor all instances of importing dimensions and metrics from individual Data Views
Conclusion
Effective Data View management in CJA is not just a technical task but a strategic capability that directly impacts analytical efficiency, data governance, and decision quality. By following the best practices outlined in this guide, from thoughtful component naming to leveraging shared components and derived fields, organizations can transform raw data into intuitive analytical environments that deliver consistent, reliable insights.
The power of CJA Data Views lies in their flexibility, but this flexibility requires disciplined governance and strategic design. When properly implemented, Data Views transform from mere technical configurations into valuable business assets that bridge the gap between complex data and actionable intelligence.
As Adobe continues to enhance CJA with AI capabilities and advanced features, organizations with strong Data View management practices will be best positioned to leverage these innovations. By investing in proper organization, documentation, and standardization today, you create a foundation for analytical excellence that will scale with your evolving needs.
Remember that Data View design is an iterative process that should evolve based on user feedback, changing business requirements, and emerging analytical needs. Regular refinement of your Data View strategy ensures your CJA implementation continues to deliver maximum value to decision-makers.