
Journey Canvas vs. Fallout vs. Flow: Choosing the Right Adobe Customer Journey Analytics Visualization
Introduction
Adobe Customer Journey Analytics (CJA) offers three standard visualization methods designed to analyze and understand customer pathways across touchpoints. These visualization options - Journey Canvas, Fallout, and Flow visualizations - each bring their own specialized capabilities to the analysis process. Journey Canvas provides a flexible and customizable interface for mapping complex customer interactions, while the Fallout visualization excels at tracking sequential progression through predefined touchpoints, and the Flow visualization enables exploration of non-linear customer movement patterns. Each of these visualization methods has been crafted to serve specific analytical needs, providing unique features and functionalities that help organizations gain deeper insights into customer behavior patterns and journey progressions.
Comparing Customer Journey Visualization Methods
To better understand how these powerful visualization methods complement each other while serving distinct analytical purposes, let's examine their unique characteristics and optimal use scenarios. Each method brings its own specialized capabilities to the journey analysis process, with specific strengths that cater to different analytical needs and objectives. For an understanding of the distinctions between these methods, you can refer to the detailed comparison matrix available in the Experience League documentation. The following high-level comparison table highlights the key differentiating factors and practical applications of each visualization option in CJA:
| Visualization | Journey Canvas | Fallout | Flow |
|---|---|---|---|
| Primary Focus | Comprehensive journey analysis | Sequential progression | Path discovery |
| Flexibility | High | Medium | Low |
| Primary Metric Support | Any metric, including calculated metrics | Only Session or Person CJA B2B Edition: Global Accounts, Accounts, Opportunities, Buying Groups |
Only Events (Path views) |
| Secondary Metric Support | Any metric, including calculated metrics | N/A | N/A |
| Best For | Complex journey analysis that tracks both eventual paths through predefined touchpoints and immediate next steps through right-click actions and drag-and-drop interactions. Note that nodes and arrows currently always follow eventual path logic. | Conversion funnels can track either eventual paths through touchpoints or be constrained to immediate next-step progression | Path-based behavior exploration and dimension item analysis (except for starting and ending touchpoints) |
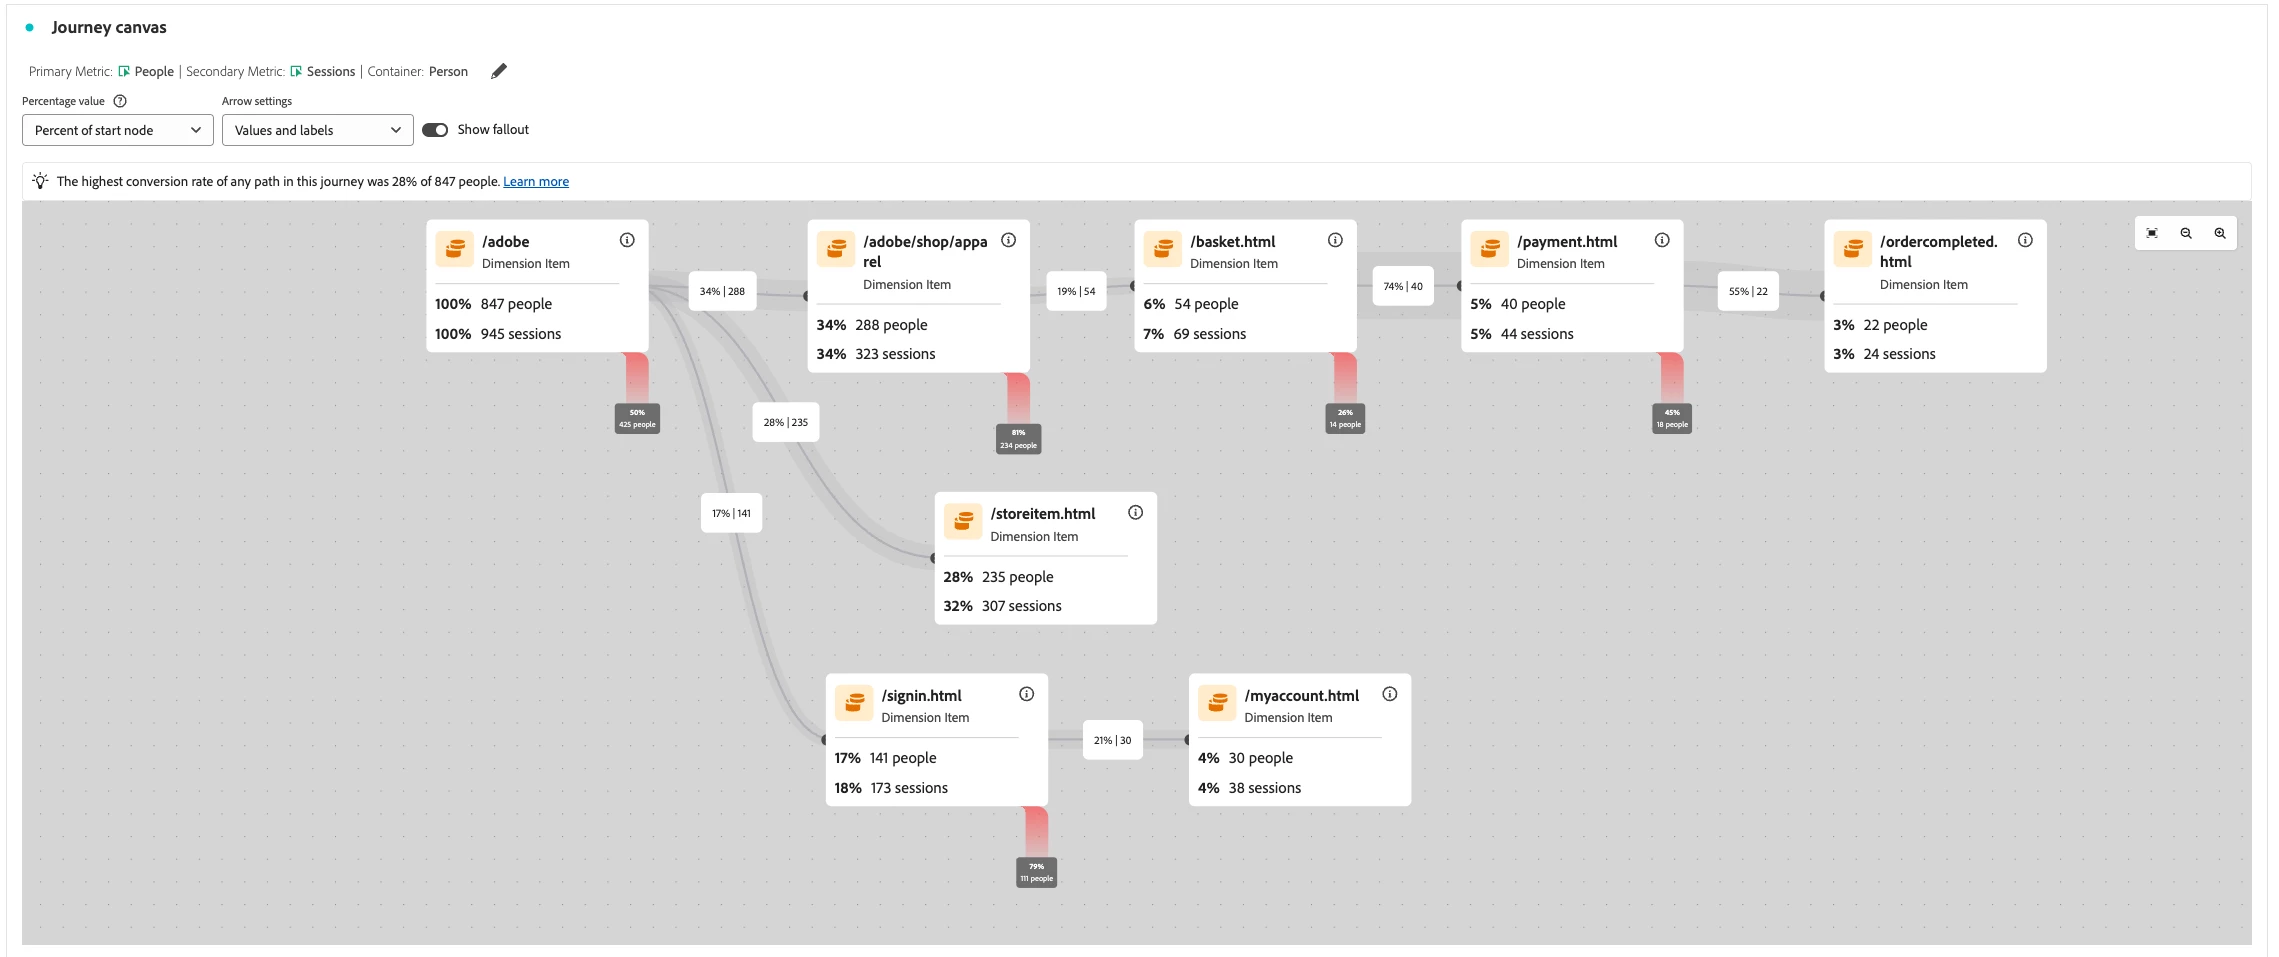
Journey Canvas Visualization
Journey Canvas stands out as the most comprehensive and adaptable visualization method in CJA, combining predefined analytical frameworks with flexible exploratory capabilities. This sophisticated visualization merges structured analysis with dynamic exploration, allowing analysts to conduct both targeted investigations and open-ended discoveries in one interface. Its dual-purpose functionality enables systematic examination of predetermined pathways while revealing unexpected insights and patterns. As CJA's most advanced customer pathway visualization method, Journey Canvas excels at deep analysis by combining structured precision with the flexibility needed for comprehensive journey exploration:
- Analyzing both linear and non-linear journeys with multiple entry points
- Supporting any metric type, including calculated metrics
- Enabling drag-and-drop component interactions
- Providing direct integration with Adobe Journey Optimizer (AJO) journeys
- Utilizing eventual path logic to track user movement between nodes
- Offering path-based filter creation from both nodes and arrows
- Enabling audience generation and publishing from journey paths
- Identifying top nodes between, before, and after specific touchpoints
Key use cases for Journey Canvas include:
- Understanding cross-device customer behavior patterns across web, mobile, and offline channels
- Analyzing the effectiveness of marketing campaigns by tracking conversion paths
- Identifying high-value customer audiences based on their journey patterns
- Optimizing customer experience by pinpointing friction points in the journey
Common applications of Journey Canvas in practice:
- Commerce purchase funnel analysis from initial browse to final checkout
- Customer support journey mapping from issue identification to resolution
- Content engagement tracking across different platforms and formats
- Cross-channel campaign performance evaluation and optimization
These use cases demonstrate Journey Canvas's versatility in handling complex, multi-touchpoint customer interactions while providing actionable insights for business optimization.
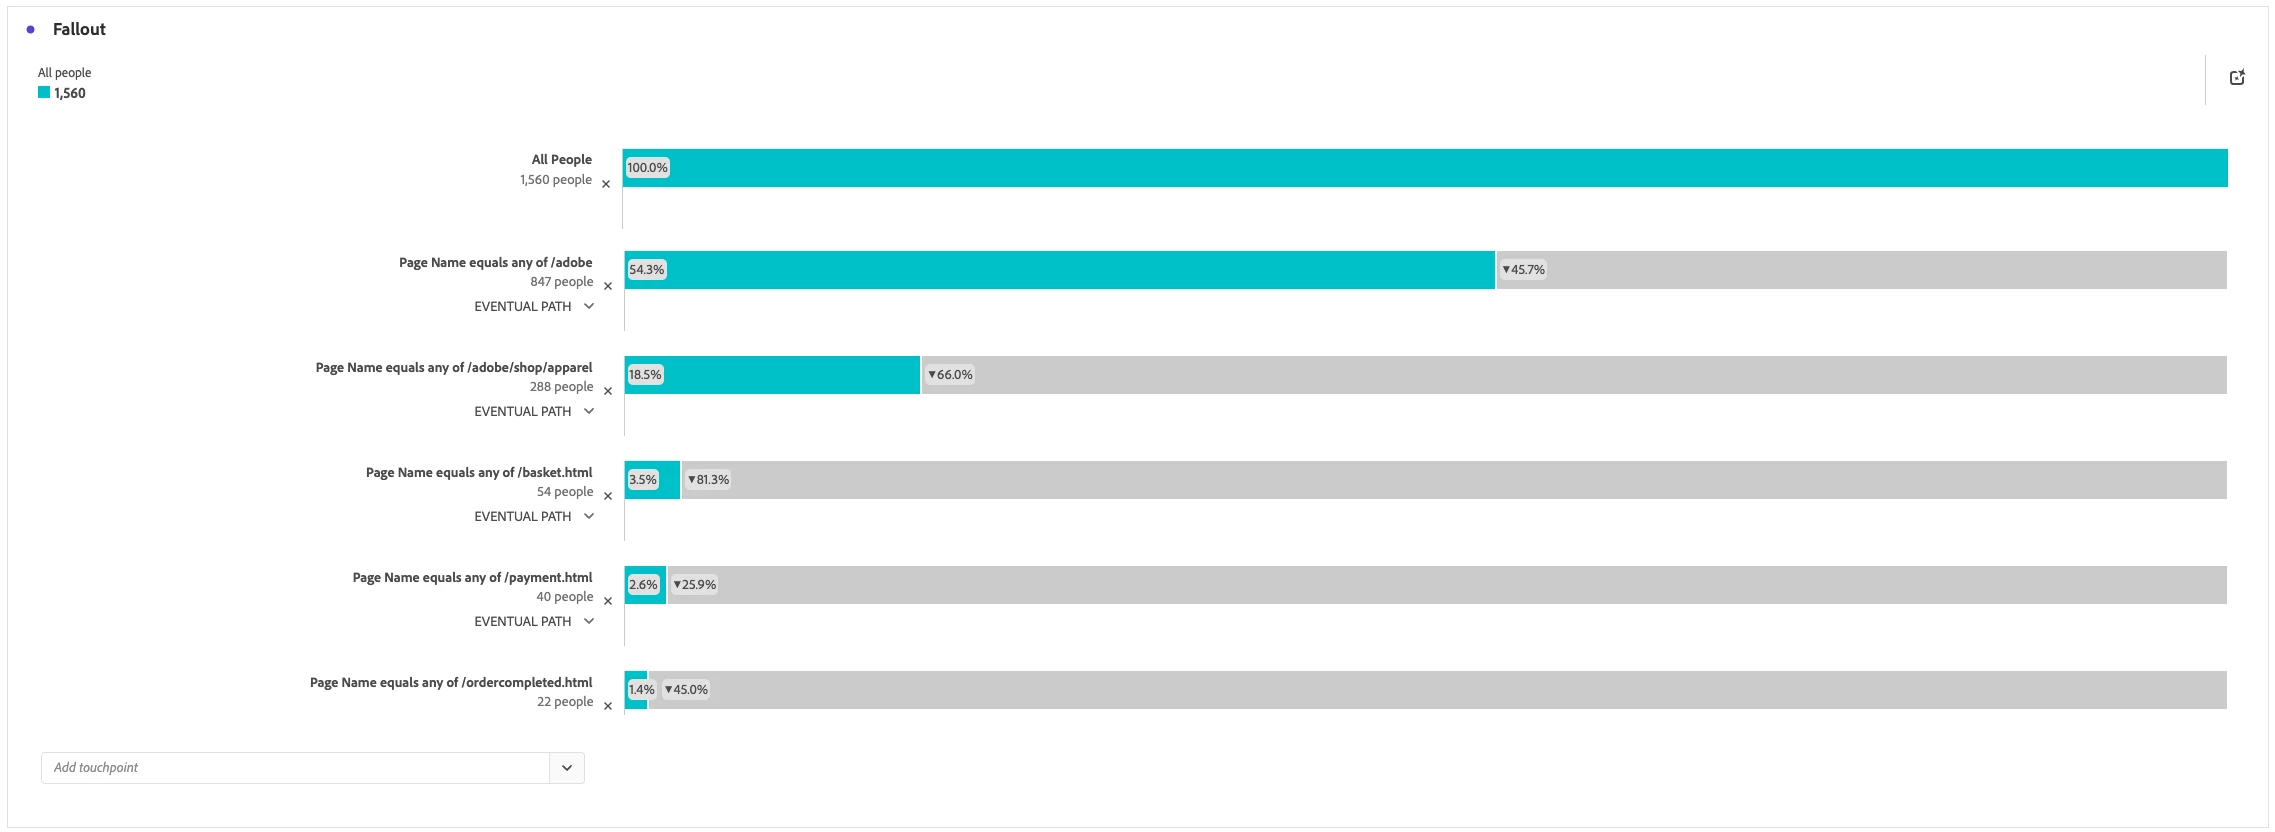
Fallout Visualization
Fallout visualization is a specialized analytical method dedicated to examining and understanding predefined sequential customer paths across touchpoints. This powerful visualization method excels particularly in tracking and analyzing structured customer journeys, providing detailed insights into progression patterns and drop-off points. As a focused method for sequential analysis, it offers organizations comprehensive capabilities for understanding linear customer pathways, with distinctive features offering:
- Linear journey analysis with clear fallout points
- Side-by-side filter comparisons
- Focus on Session or Person metrics
- Support for eventual path or next touchpoint constraints
Key use cases for Fallout visualization include:
- Analyzing conversion funnels and identifying drop-off points in sales processes
- Tracking user progression through specific feature adoption paths
- Monitoring customer journey completion rates across defined touchpoints
- Evaluating onboarding sequence effectiveness and completion rates
Common applications of Fallout visualization in practice:
- Subscription sign-up process optimization
- Commerce checkout funnel analysis
- User registration flow improvement
- Multi-step form completion tracking
These applications highlight Fallout visualization's strength in analyzing structured, sequential customer journeys and identifying opportunities for optimization.
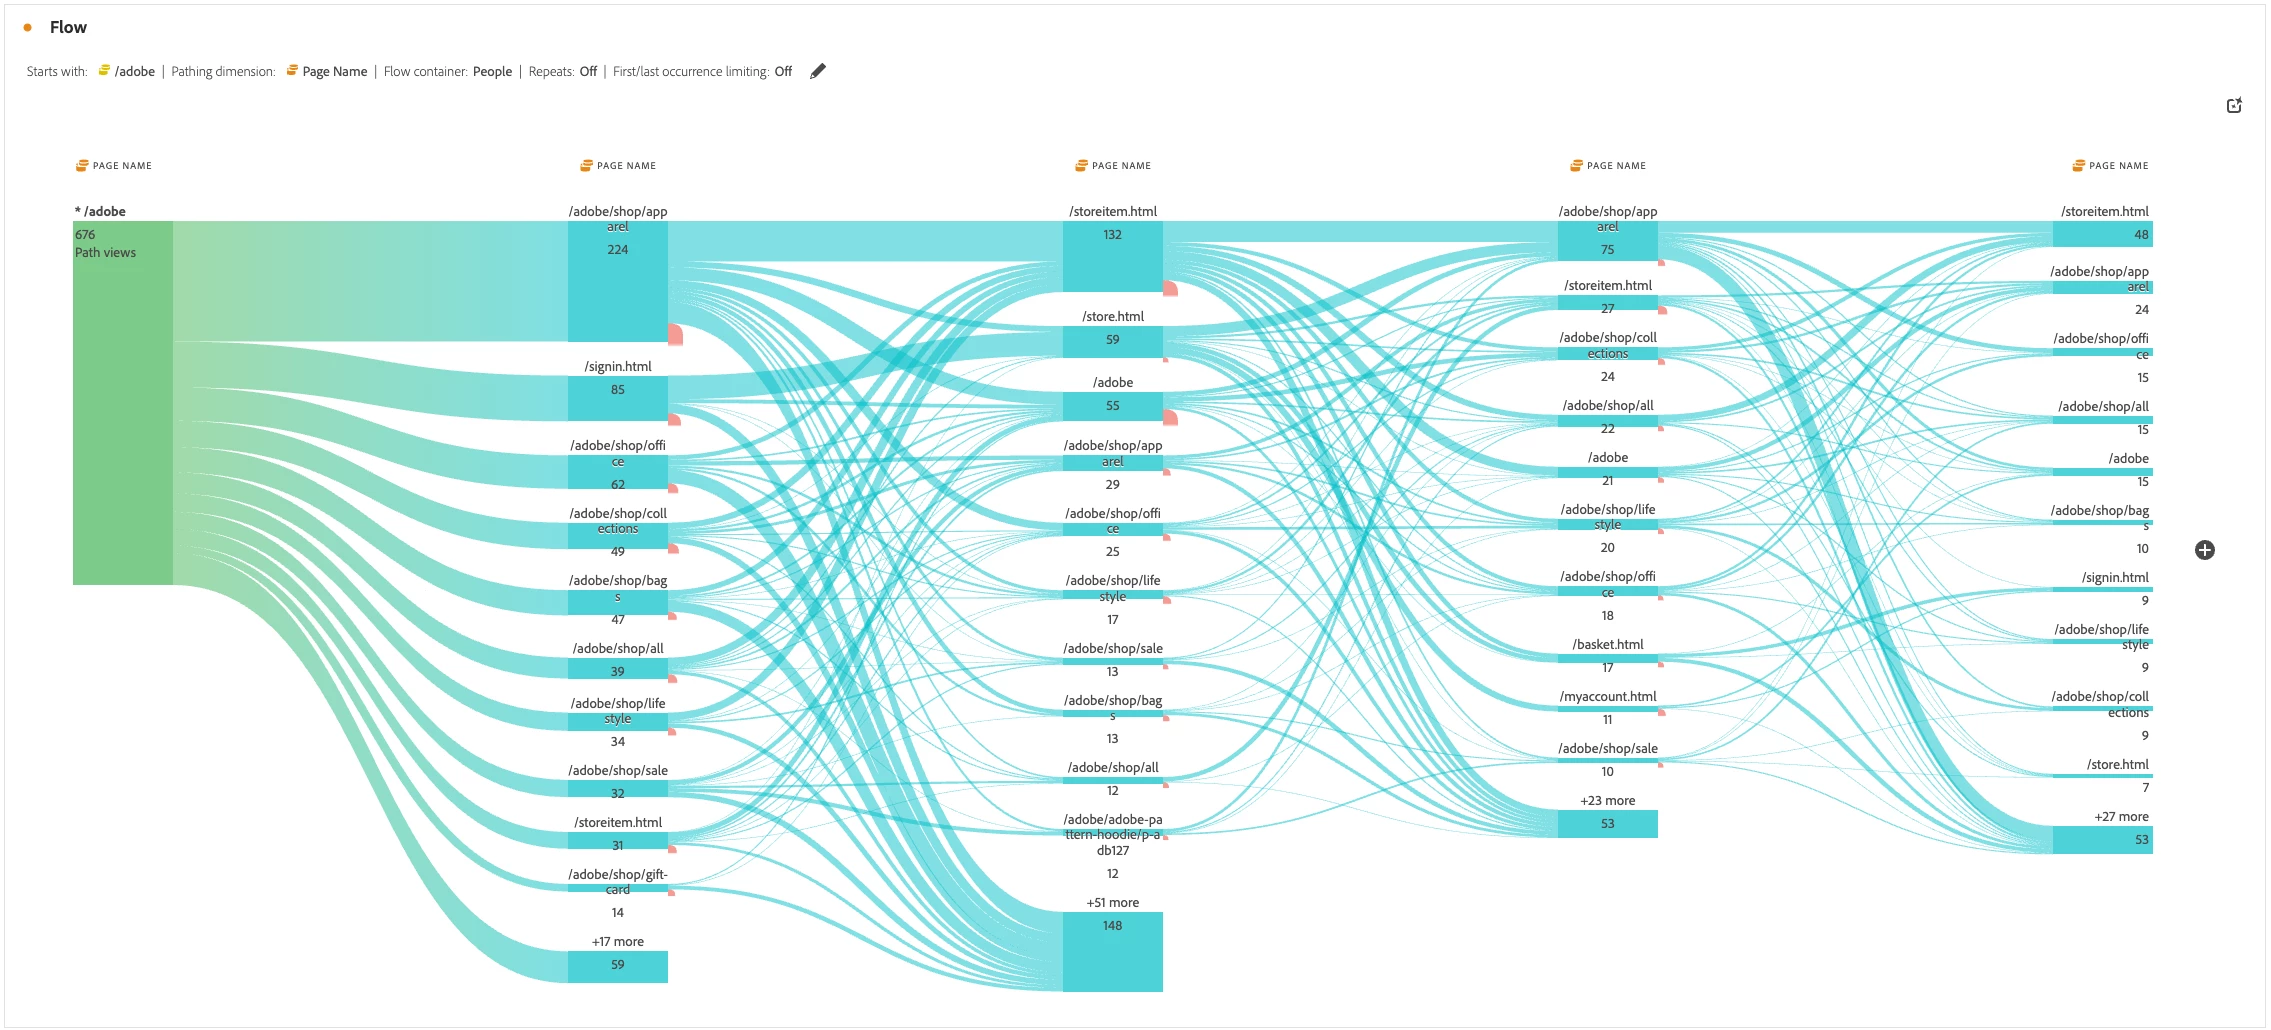
Flow Visualization
Flow visualization serves as a method specifically engineered for exploratory analysis of customer journeys, enabling organizations to discover and understand emerging patterns in customer behavior through dynamic path exploration. This visualization method excels in uncovering unexpected journey patterns and revealing natural customer movement through various touchpoints, featuring:
- Non-linear journey exploration with multiple paths
- Immediate next touchpoint analysis
- Focus on Event-based metrics
- Visualization of exploratory customer paths
Key use cases for Flow visualization include:
- Discovering natural customer navigation patterns across digital properties
- Identifying common entry and exit points in customer journeys
- Understanding customer behavior variations across different audiences
- Analyzing content discovery patterns and content relationships
Common applications of Flow visualization in practice:
- Website navigation pattern analysis
- Content consumption sequence discovery
- App feature usage flow mapping
- Cross-channel and platform interaction pattern analysis
These applications demonstrate Flow visualization's effectiveness in uncovering natural customer movement patterns and identifying opportunities for journey optimization.
Conclusion
CJA offers three visualization methods for analyzing customer journeys across dimensions and scenarios. Journey Canvas is the most versatile, combining structured frameworks with exploratory features while supporting extensive metrics and Adobe Journey Optimizer integration. Fallout visualization specializes in analyzing sequential customer progression, providing insights into conversion paths and drop-off points along predefined journeys. Flow visualization helps discover and understand organic patterns in customer behavior, revealing natural movement pathways that might otherwise go unnoticed.
When choosing a visualization method, carefully consider your analytical needs. Journey Canvas works best for complex analyses requiring flexible metric combinations and sophisticated journey mapping. Fallout visualization is ideal for tracking specific progression sequences through predetermined touchpoints. Flow visualization excels at exploring organic customer movements and behavioral patterns. By selecting the right visualization method for each analysis, organizations can gain deeper insights into customer journeys, identify optimization opportunities, and improve customer experience and business outcomes.