
A Guide to Journey Canvas Visualization in Adobe Customer Journey Analytics
Introduction
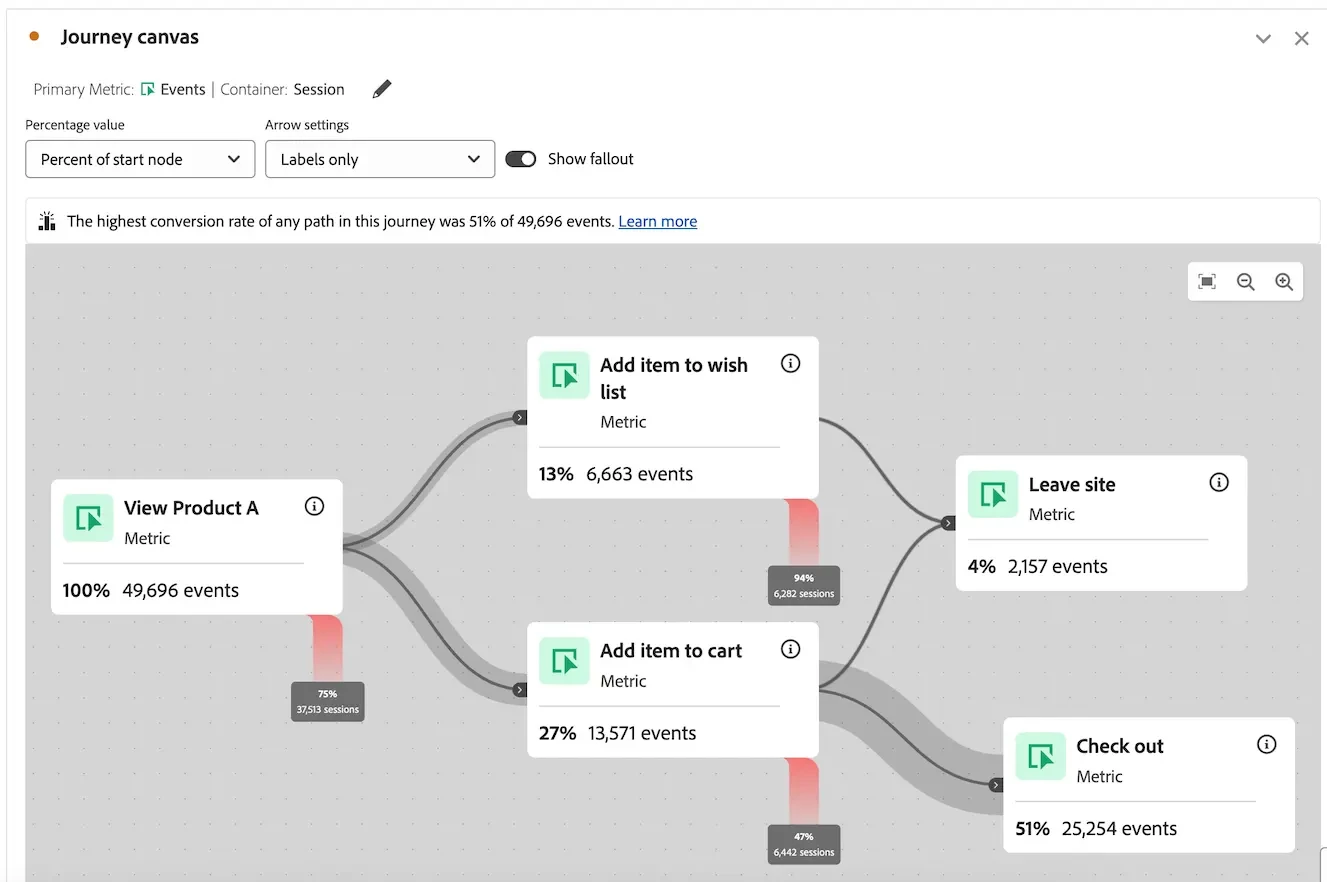
The Journey Canvas visualization in Adobe Customer Journey Analytics (CJA) helps analysts map and understand how users move through different touchpoints in their journey. It allows dynamic exploration of customer behavior patterns, interaction sequences, and engagement flows across channels and platforms. In this blog post, we'll explore strategies for using this visualization to gain meaningful insights into your customers' journeys.
Think of Journey Canvas as a GPS for your customers' experience. Just as GPS tracks routes from start to finish, Journey Canvas shows how customers navigate through your touchpoints. The tool connects various touchpoints (called nodes) along the customer's path, like pins on a map. You can spot popular routes, identify where users leave, and discover which paths lead to successful outcomes like purchases. These insights help businesses improve their customer experiences and boost customer satisfaction.
Similar to how a traffic analyst studies urban road patterns and vehicle movements to enhance city traffic flow and reduce congestion, Journey Canvas empowers analysts to examine and systematically optimize the ways customers navigate through various touchpoints and interaction pathways. This powerful visualization tool enables analysts to identify bottlenecks, understand preferred routes, and implement improvements that create smoother, more efficient customer journeys across platforms and channels.
Journey Canvas Reference Documentation
Check out these Adobe Experience League resources to help you master Journey Canvas:
- Overview and Getting Started: Learn the fundamentals, setup process, and basic usage of Journey Canvas visualization
- Configuration Guide: Step-by-step instructions for configuring Journey Canvas, including available settings and customization options
- Troubleshooting Guide: Solutions for common issues and tips for optimizing your Journey Canvas implementation
- Choose between Journey canvas, Fallout, or Flow visualizations Compare Journey Canvas with the Fallout visualization and Flow visualization to understand their differences.
Understanding Journey Canvas
Journey Canvas is a visualization feature that analyzes customer interactions across touchpoints using a common namespace ID (Person ID) within a Connection or stitched Person ID. It helps analysts track customer paths from initial contact through conversion and beyond. The visual interface allows you to map customer routes, identify behavioral patterns across segments, and uncover opportunities for journey improvements. This feature enables you to progressively explore complex customer experiences.
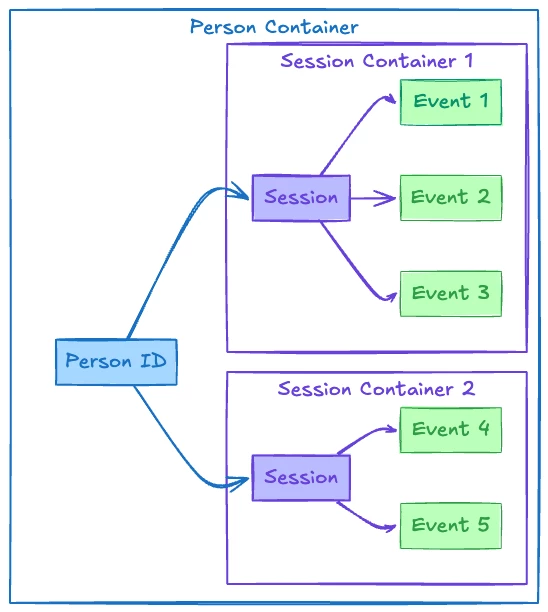
The diagram above illustrates how the person container acts as the outermost boundary containing all information specific to an individual across CJA sessions and events. Within this container, session containers are nested and contain groups of events based on the session expiration logic configured in the given Data View. Individual events are tracked within these session containers, allowing for hierarchical analysis of customer behavior from full person-level data down to granular event interactions.
When this container model is applied to Journey Canvas node paths:
- Person Container data influences the overall journey context and maintains Person ID-based continuity across touchpoints
- Session Container boundaries determine how events are grouped into meaningful interaction sequences
- Individual Events serve as the basic building blocks for journey nodes, each representing a specific interaction or touchpoint
Journey Canvas visualization structures data hierarchically. At the top level, the person container can hold multiple session containers. Each session container organizes related events according to defined session settings. Within these containers, individual event nodes show specific interactions or touchpoints that can be analyzed using the Data View's dimensions and metrics.
This hierarchical structure allows analysts to:
- Track user journeys across sessions while preserving person-level context
- Organize interactions based on session-aware timeout conditions
- Use dimensions and metrics to examine touchpoint behavior
- Build detailed journey visualizations that accurately show how users move through platforms and channels
When calculating data for nodes and arrows in Journey Canvas, the system employs a specific sequential filters approach. For each node, it runs a sequential filter in "Only After Sequence" mode and excludes all events that occur after the target event. This precise calculation method ensures that metrics are computed exclusively for the exact event of the node in question, rather than including subsequent events. This approach provides accurate measurement of user behavior at each specific touchpoint in the journey, allowing for more precise analysis of how users progress through different stages of their experience.
Understanding how Journey Canvas functions requires examining both its core purpose and key capabilities. Let's break down the essential aspects of this visualization feature to better understand how it can enhance your customer journey analysis:
Core Purpose and Functionality:
- Maps customer behavior patterns and interactions across channels and platforms
- Visualizes customer paths from initial touchpoint to final destinations
- Offers exploration through an interactive visual interface
- Facilitates journey comparison between different customer segments and time periods
Key Capabilities:
- Visual Interface: Drag-and-drop interface for building journey node flows and explore customer paths dynamically
- Component Integration: Combines events, dimensions, filters, and date ranges to create journey nodes
- Customization Options: Customizable for different filters, time periods, and interaction types
- Cross-Analysis: View customer interactions across multiple platforms and channels in a single visualization
- Path Analysis: Identify common paths, drop-off points, and conversion patterns in your customer journey
- Flexible Configuration: Customize your visualization to focus on specific segments, time periods, or interaction types
- Create Filter: Create filters based on specific journey paths to analyze users who follow particular interaction sequences. You can generate these path-based filters from both nodes and arrows, enabling precise segmentation and detailed journey analysis
- Create Audience: Generate and publish audiences from journey paths and nodes to enable personalized targeting. You can create these filter-based audiences using either nodes or arrows.
- Breakdown: Analyze path segments and interactions between and within nodes to understand specific customer behaviors and movement patterns
- Trend: Examine patterns and changes in customer journey behavior over time to identify emerging patterns and seasonal variations
- Show Top Nodes Between Nodes: Discover the most common intermediate node touchpoints in customer journeys, revealing interaction points that might otherwise be overlooked
- Show Top Before/After Nodes: Identify and analyze the most frequent preceding and subsequent node touchpoints for any given node, helping optimize journey flows and anticipate customer behavior
- Augments Other CJA Visualizations: Works alongside Flow and Fallout diagrams to provide comprehensive journey analysis
Journey Canvas helps analysts uncover deep insights into customer experiences and behavior patterns. Through its analytical capabilities, teams can pinpoint pain points in the customer journey and identify opportunities for improvement. With its intuitive visual interface and robust analysis tools, Journey Canvas transforms complex interaction data into actionable insights—leading to meaningful improvements across all customer touchpoints and channels.
How to Navigate to Journey Canvas in Customer Journey Analytics:
- In Customer Journey Analytics, select Workspace.
- In the top navigation, choose Project, then click Create project.
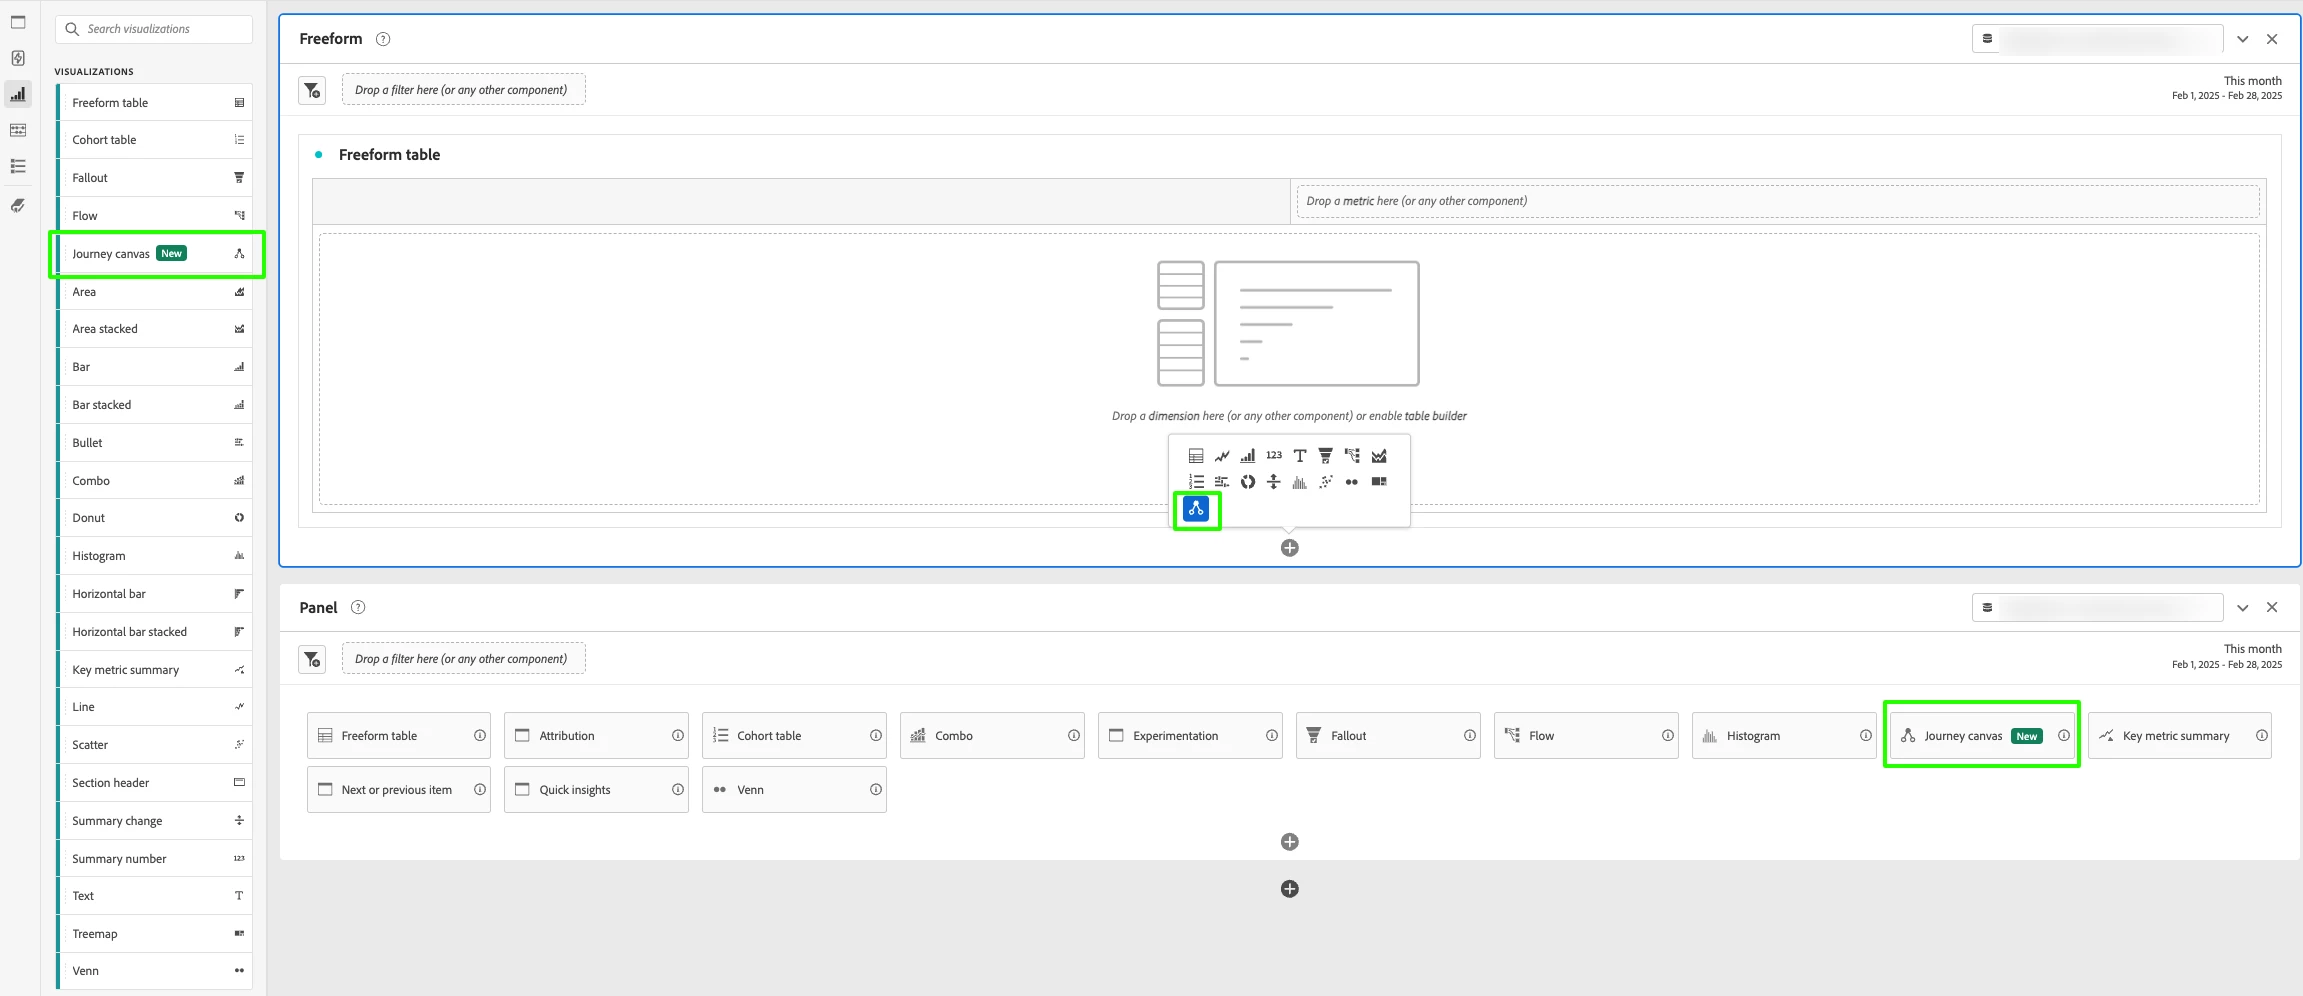
- Add Journey Canvas by selecting it from the Visualizations tab in the left rail, clicking the "+" button at the bottom of a panel, or choosing it from within a Blank Panel.
Journey Canvas Configuration
The Configure a Journey canvas visualization documentation outlines several considerations for setting up your Journey Canvas visualization to create an effective analytical view:
You can build analyses of user journeys by using any combination of events, dimension items, filters, and date ranges to create journey nodes. Connect the nodes to create the journey's flow, and include multiple paths and decision points. Drag nodes on the canvas to rearrange the events and conditions of the journey. Data updates in real time as you make changes.
Nodes are connected as an "eventual path," which means that visitors are counted as long as they eventually move from one node to the other, regardless of any events occurring between the 2 nodes. The time allotted for users to move along the path is determined by the container setting.
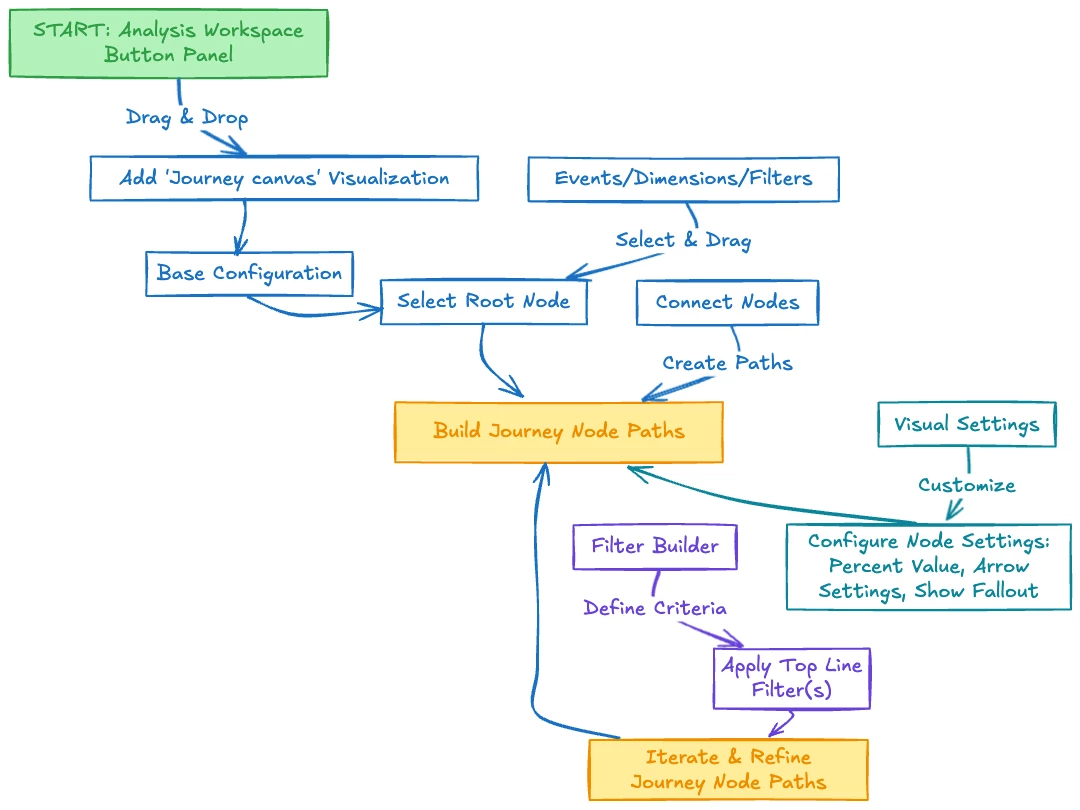
Here's a breakdown of the steps for configuring Journey Canvas in CJA, ensuring you can effectively visualize and analyze customer journey patterns:
- Add the ‘Journey Canvas’ Visualization: Begin by accessing the Visualizations panel located in the left rail of your workspace. From there, locate the Journey Canvas option and use the drag-and-drop functionality to place it within your Freeform Canvas location
- Base Configuration: Choose a Primary metric and an optional Secondary metric, then set the Journey Canvas container to either Session-based or Person-based (available in advanced settings)
- Select Root Node: Establish your journey's foundation by carefully selecting and dragging your preferred components (which can include events, dimensions, or filters) from the left rail to create your initial node. This serves as the starting point for your entire journey analysis
- Build Journey Node Paths: Expand your visualization by strategically adding subsequent nodes through the drag-and-drop interface. This allows you to create meaningful connections and establish branching direction points that accurately represent your customer journey patterns
- Configure Node Settings: Fine-tune your visualization by adjusting node settings (Percent Value, Arrow Settings, Show Fallout) to customize appearance and behavior according to your analysis requirements
- Apply Top Line Filters: Enhance the precision of your analysis by utilizing the advanced filter builder functionality to create top line filters and apply specific criteria that align with your analytical objectives
The Journey Canvas configuration process is designed to be both flexible and iterative in nature, providing analysts with the freedom to continuously modify and expand their journey visualizations. This adaptability enables teams to progressively refine their analysis and uncover increasingly deeper insights into customer behavior patterns across various touchpoints and interactions.
Best Practices for Journey Canvas Analysis
To maximize the value and effectiveness of your Journey Canvas analysis within CJA, it's essential to follow a structured approach that ensures proper data exploration and meaningful insights. The following best practices will help you leverage the full potential of this powerful visualization tool to uncover valuable patterns in your customer journey data:
- Defined Objectives: Begin with clear, specific goals about what insights you want to discover from your customer journeys
- Apply Strategic Filtering: Use filters strategically to focus on specific customer segments or behaviors
- Combine Visualizations: Combine Journey Canvas with other CJA visualization panels for comprehensive analysis
- Review and Iterate: Regularly review and iterate your journey analysis to identify new patterns and opportunities. To explore multiple journey variations, use the Copy visualization option in the visualization 'Context menu'. This allows you to insert the visualization elsewhere in your current project or into a different project.
- Analyze Path Segments: To analyze specific path segments, click any arrow between nodes and select 'Create filter from arrow'. This generates filter logic for that path segment—a useful technique for deep analysis of connection points. Keep in mind that the filter created from an arrow may differ from the node filter when multiple arrows lead into the end node.
- Focus on Critical Journey Nodes: Select the most important touchpoints and events that represent critical stages in your customer journey
- Leverage Drag-and-Drop: Use the visual interface to construct and modify journey flows dynamically as you explore customer paths
- Create Comprehensive Paths: Combine events, dimension items, filters, and date ranges to build detailed journey visualizations
- Switch Perspectives: Explore data from multiple angles by quickly alternating between different configuration settings to uncover insights
- Build into Dashboards: Create clear, interactive visualizations that make complex journey insights easy for stakeholders to understand
- Monitor Conversion Patterns: Identify and analyze common paths and drop-off points in your customer journey to optimize the experience
- Share Insights: Distribute journey canvas analysis findings throughout your organization to build a unified understanding of customer behavior. To include the journey visualization as a PDF, navigate to Project > Download PDF.
Conclusion
Journey Canvas visualization stands as a transformative option in your CJA analytical toolkit, offering new capabilities for developing comprehensive insights into customer behavior patterns and facilitating strategic decisions. Through its accessible and visual interface, combined with sophisticated analytical capabilities, this powerful feature empowers analysts to delve deep into customer interaction data, revealing previously hidden patterns and meaningful trends. These discoveries can then be translated into concrete actions that systematically enhance and refine the customer experience across every interaction point and channel touchpoint. The visualization's robust feature set not only simplifies complex data analysis but also enables teams to identify opportunities for optimization that might otherwise remain undiscovered, ultimately leading to more informed and effective customer experience strategies.
As you begin exploring Journey Canvas in your Analysis Workspace environment, consider how this visualization serves as your digital compass through the customer journey landscape. Just as a GPS system helps travelers navigate complex routes by providing guidance and alternative pathways, Journey Canvas empowers analysts to map, understand, and optimize their customers' digital experiences with clarity. Through methodical experimentation with different journey paths, node configurations, and analytical approaches, you'll uncover insights into user behavior patterns and interaction preferences. These discoveries will illustrate how customers navigate through your various touchpoints, enabling you to make data-informed decisions that enhance their experience at every step. By maintaining a curious and exploratory mindset while working with Journey Canvas, you'll continue to discover new ways to leverage its capabilities for deeper understanding and meaningful optimization of the customer journey.