Hello, Lets assume that on our site developments teams tests its application with browsers that consist at least 80% of traffic on any given time. Now I should only know what they those browsers are, and tell them, right
I can easily list the percentage share of each browser, but how to make a calculated metric that would list the browsers needed to break that 80% threshold. For example on the snip attached the last browser would be Safari 13.0.5
Of course i could always tell team to count them by themselves, or use take csv-file but im looking for more elegant way...
Thanks tr
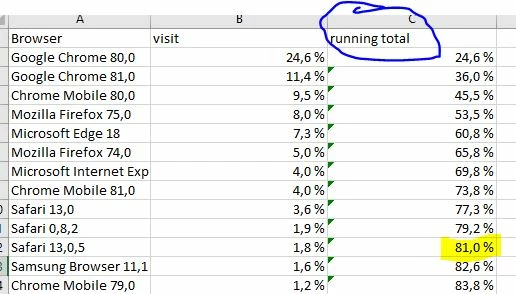
Solved! Go to Solution.
Views
Replies
Total Likes
Create a calculated metric with the cumulative function. While it will not allow you to filter the list automatically, it will definitely help build the table you shared in the screenshot.
---
Help make Adobe Analytics better, vote for the ideas:
Views
Replies
Total Likes
Create a calculated metric with the cumulative function. While it will not allow you to filter the list automatically, it will definitely help build the table you shared in the screenshot.
---
Help make Adobe Analytics better, vote for the ideas:
Views
Replies
Total Likes
Thanks Andrey,
I have used cumulative function using dates before succesfully, but with this case my approach did not work.
I checked your link once again, and it stated, that "Since it's ordered by the dimension it's only useful on dimensions that have a natural order like date or path length." so to my understanding my case cannot be solved, as my dimension is not 'Day', 'Month' but rather 'Browser' which doesnt have a natural order. What i get, see below. On dates it works fine, but Browser cumulative table does not make any sense
BR, tr
Views
Replies
Total Likes
Views
Replies
Total Likes
Views
Likes
Replies