
Optimizing and Validating Adobe Journey Optimizer Step Events: Performance Analytics, Feedback Integration, and Guardrail Monitoring
Optimizing and Validating Adobe Journey Optimizer Step Events: Performance Analytics, Feedback Integration, and Guardrail Monitoring
This is Part 3 of a 3-part series on Step Events in Adobe Journey Optimizer. Jump to: Mastering Step Events in Adobe Journey Optimizer: Fundamentals, Schema, and Essential Queries for Data-Driven Campaigns | Troubleshooting Step Events in Adobe Journey Optimizer: Diagnosing Errors, Discards, and Failures for Reliable Customer Journeys | Optimizing and Validating Adobe Journey Optimizer Step Events: Performance Analytics, Feedback Integration, and Guardrail Monitoring
Your dashboard suddenly screams: latency red-line! You're the pit-crew chief, and every second counts. Grab Step Events and let's check tyre pressure on those journeys.
Adobe's Examples of queries already cover elapsed-time and daily-active metrics. Below, we ratchet up the analysis with node complexity, per-minute heatmaps and guardrail alerts.
⚠️Schema disclaimer – Field names may evolve. Always verify against the public XDM reference: https://github.com/adobe/xdm/tree/master/docs/reference/adobe/experience/journeyOrchestration .
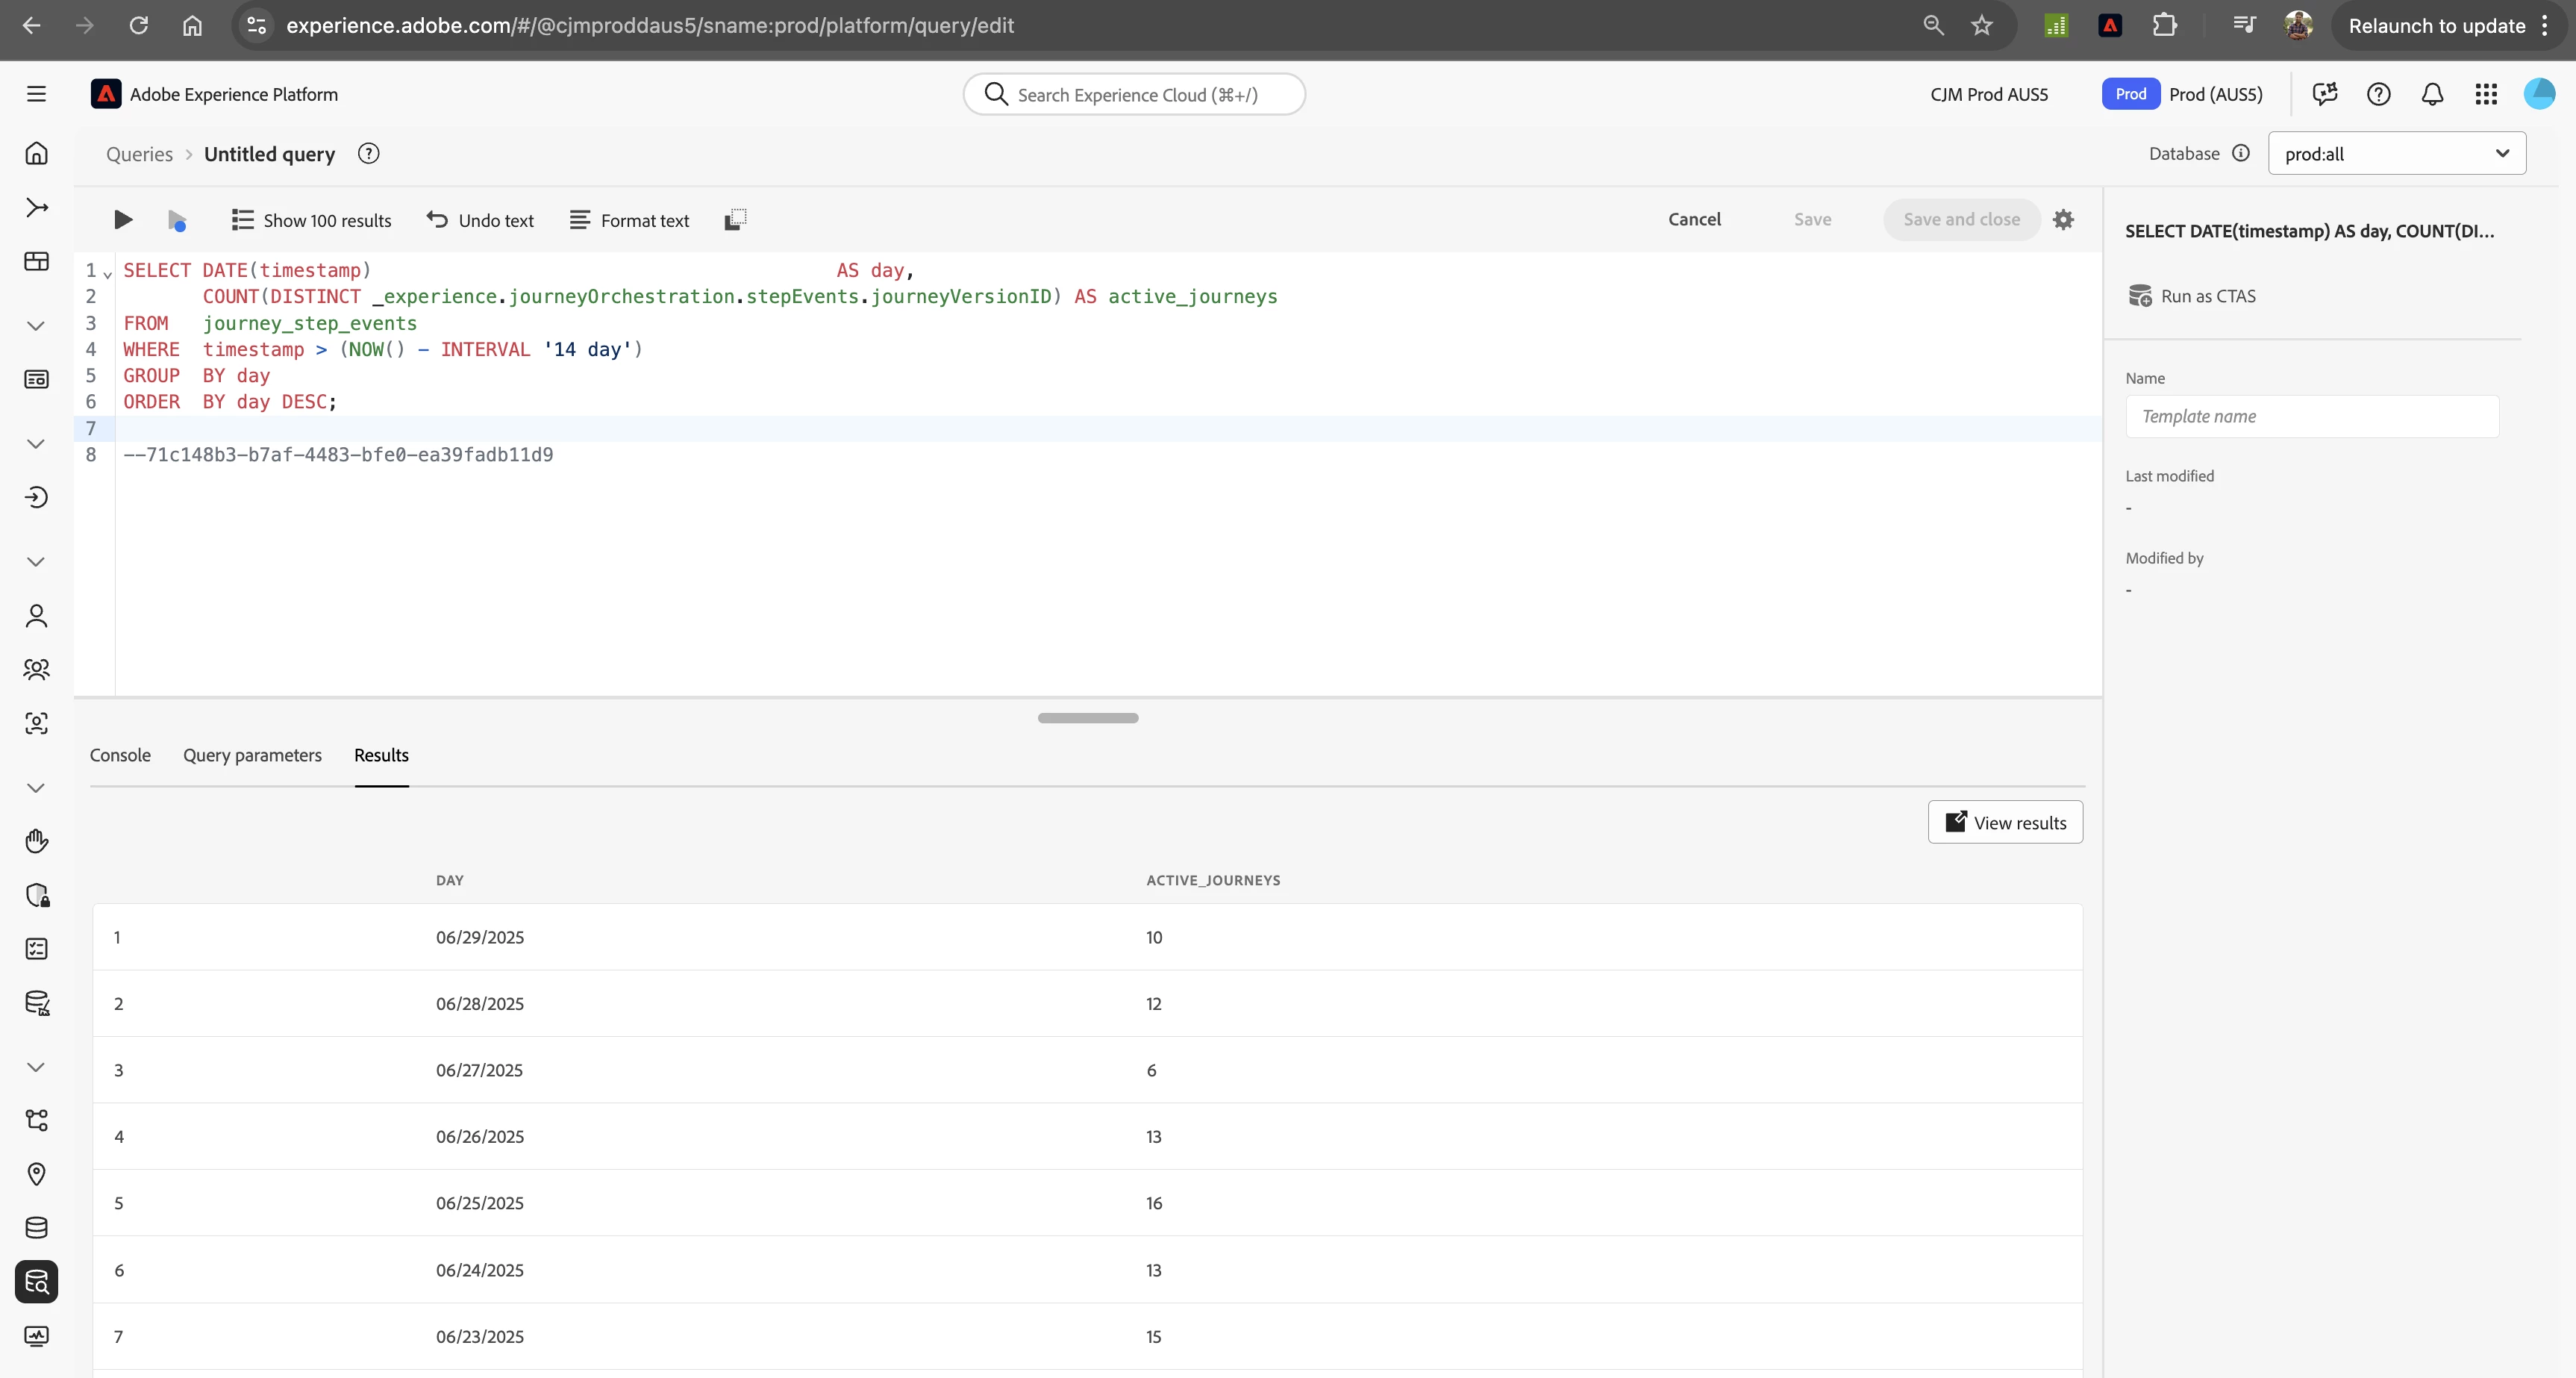
i) Counting Daily Active Journeys: Performance Monitoring with Step Events in Adobe Journey Optimizer
First, let's get a bird's-eye view of your instance's daily activity over the last two weeks.
SELECT DATE(timestamp)                                         AS day,
       COUNT(DISTINCT _experience.journeyOrchestration.stepEvents.journeyVersionID) AS active_journeys
FROM   journey_step_events
WHERE  timestamp > (NOW() - INTERVAL '14 day')
GROUP  BY day
ORDER  BY day DESC;
ii) Complexity Indicator – Nodes per Journey
Are some of your journeys becoming too complex? This query flags those with a high node count, which often require performance tuning.
SELECT _experience.journeyOrchestration.stepEvents.journeyVersionName AS journey,
       COUNT(DISTINCT _experience.journeyOrchestration.stepEvents.nodeName)      AS nodes,
       MAX(DATE(timestamp))                                                     AS last_seen
FROM   journey_step_events
GROUP  BY journey
ORDER  BY nodes DESC;
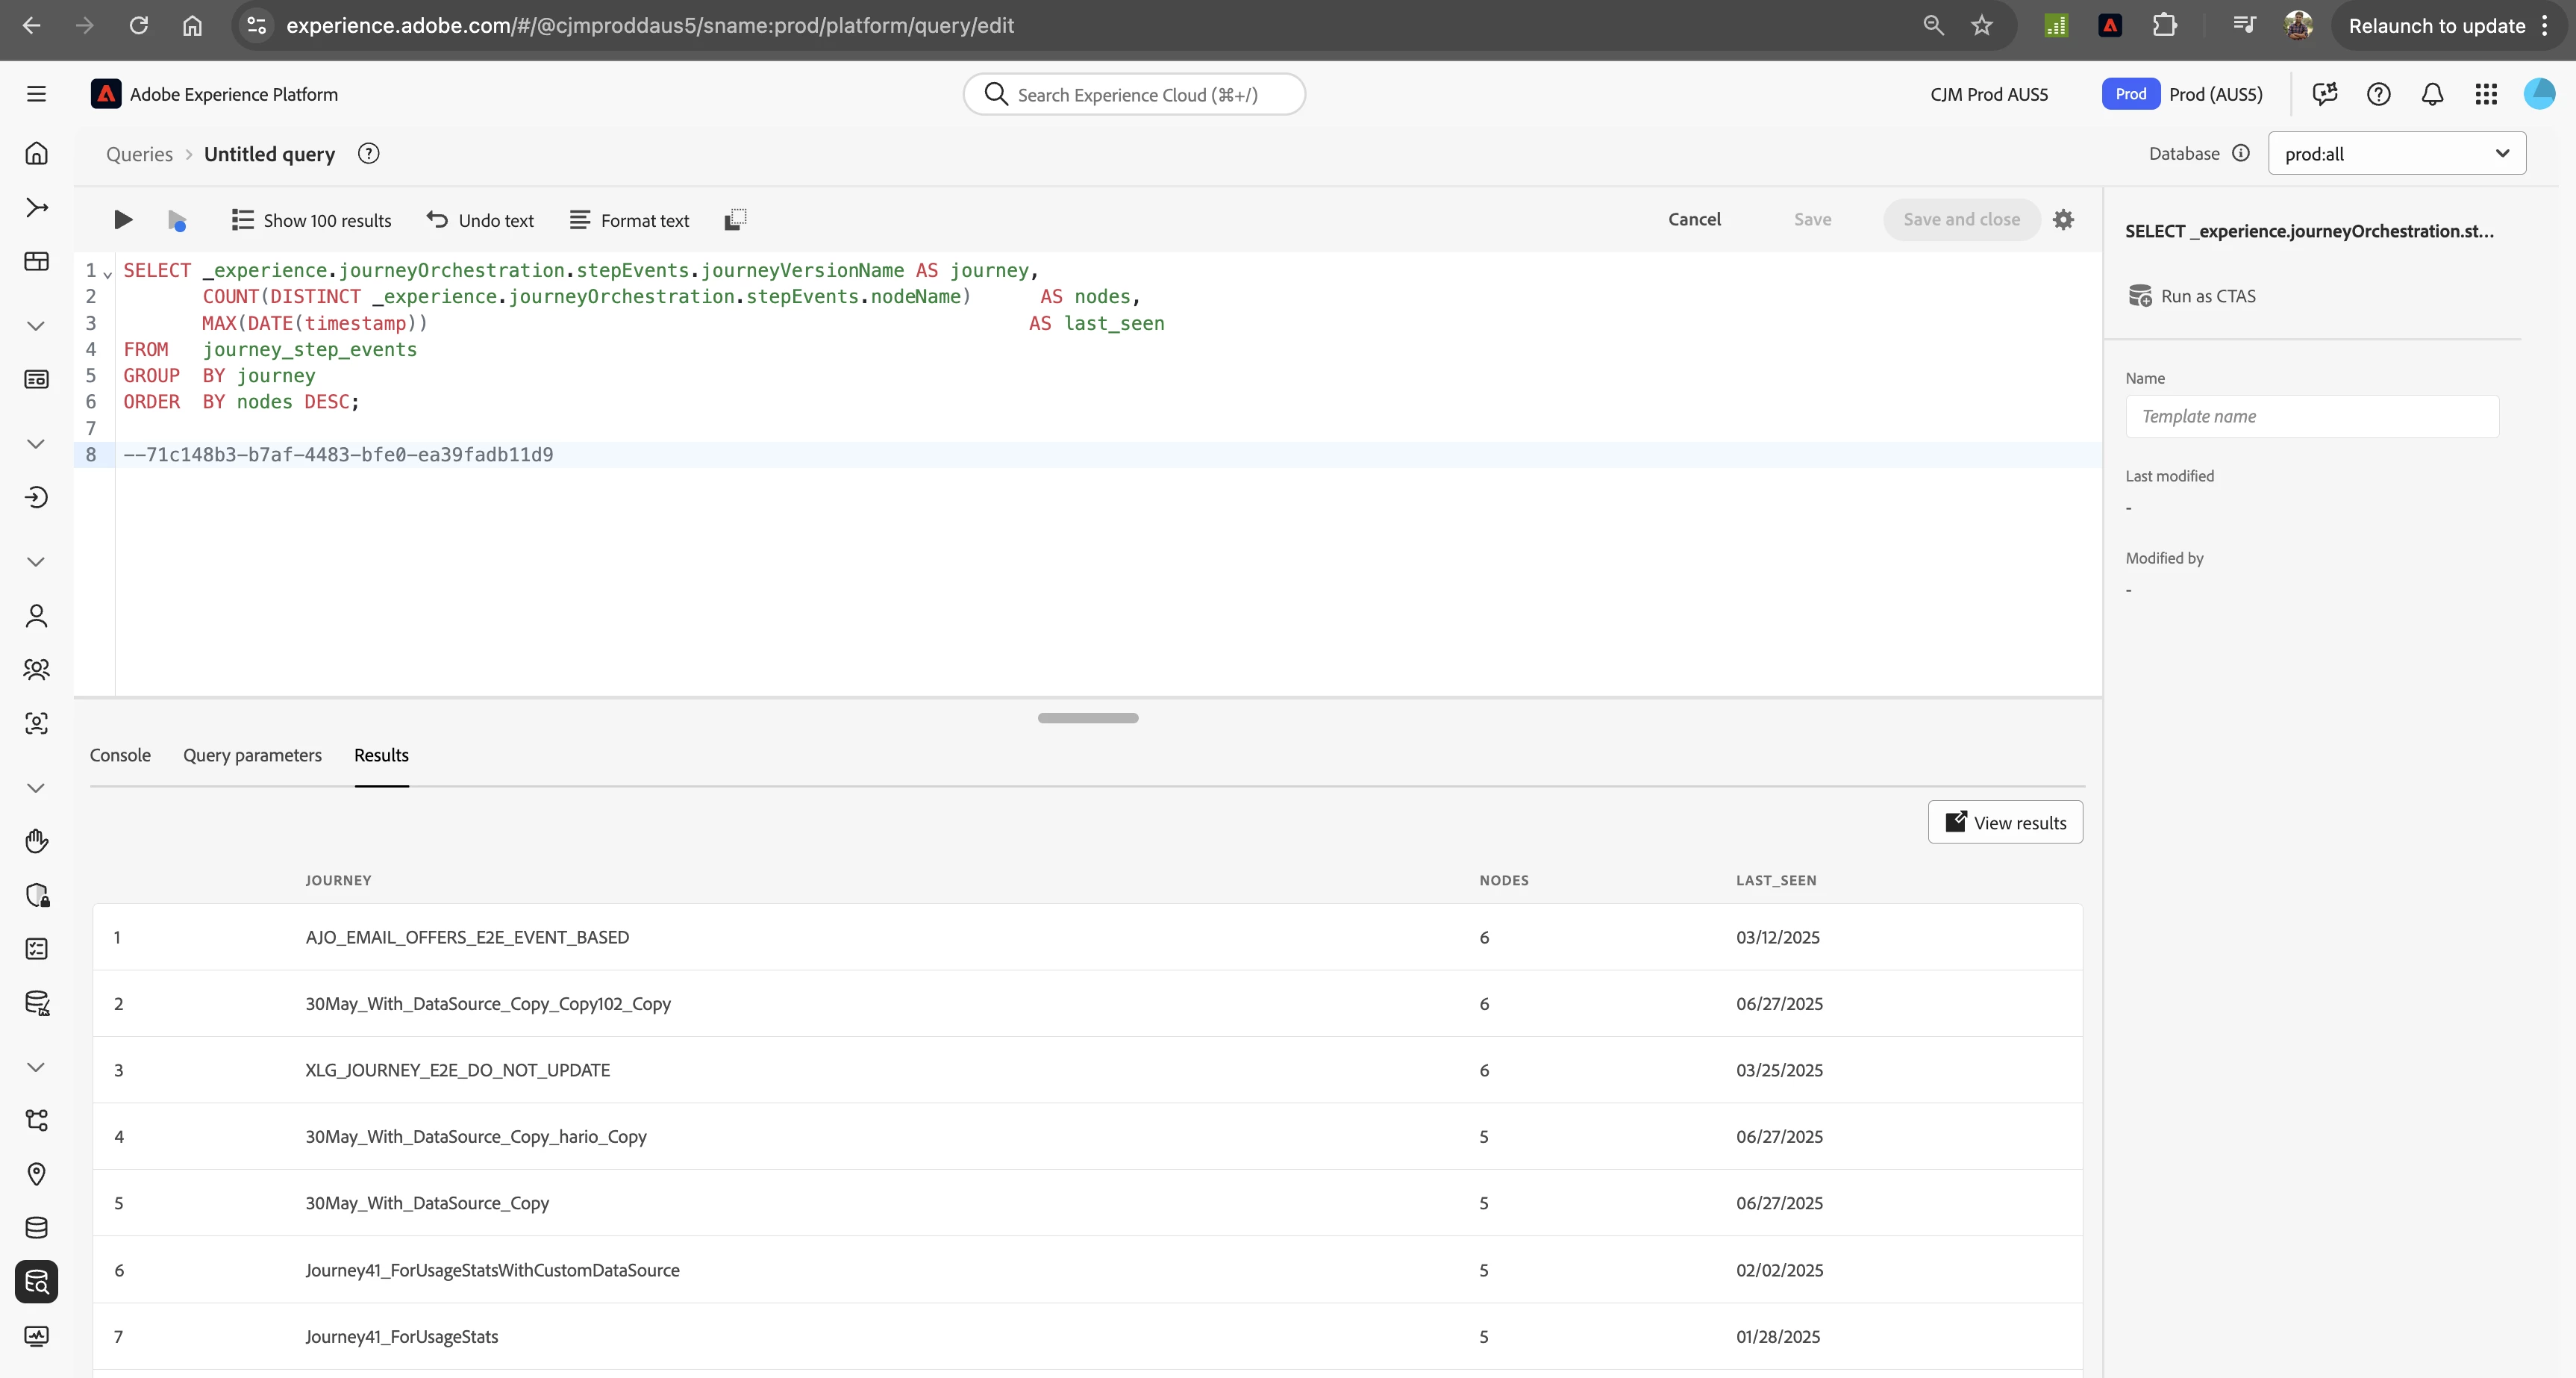
Journeys with 50+ nodes often need special rate-limit tuning.
iii) Detecting Wait Bottlenecks (Elapsed Time)
Is a 'wait' step causing a traffic jam? This query measures the average and maximum time profiles spend waiting between two nodes.
WITH before AS (
  SELECT
    _experience.journeyOrchestration.stepEvents.instanceID AS iid,
    unix_timestamp(timestamp) AS ts_secs
  FROM journey_step_events
  WHERE _experience.journeyOrchestration.stepEvents.journeyVersionID = '<journeyVersionID>'
    AND _experience.journeyOrchestration.stepEvents.nodeName = '<Node-Before-Wait>'
    AND _experience.journeyOrchestration.stepEvents.journeyNodeProcessed = TRUE
),
after AS (
  SELECT
    _experience.journeyOrchestration.stepEvents.instanceID AS iid,
    unix_timestamp(timestamp) AS ts_secs
  FROM journey_step_events
  WHERE _experience.journeyOrchestration.stepEvents.journeyVersionID = '<journeyVersionID>'
    AND _experience.journeyOrchestration.stepEvents.nodeName = '<Wait-Node-Name>'
    AND _experience.journeyOrchestration.stepEvents.journeyNodeProcessed = TRUE
),
deltas AS (
  SELECT
    a.iid,
    (a.ts_secs - b.ts_secs) AS wait_seconds
  FROM before b
  JOIN after a
    ON a.iid = b.iid
)
SELECT
  COUNT(*) AS pairs_evaluated,
  COALESCE(AVG(wait_seconds), 0) AS avg_seconds,
  COALESCE(MAX(wait_seconds), 0) AS max_seconds
FROM (SELECT * FROM deltas) t;
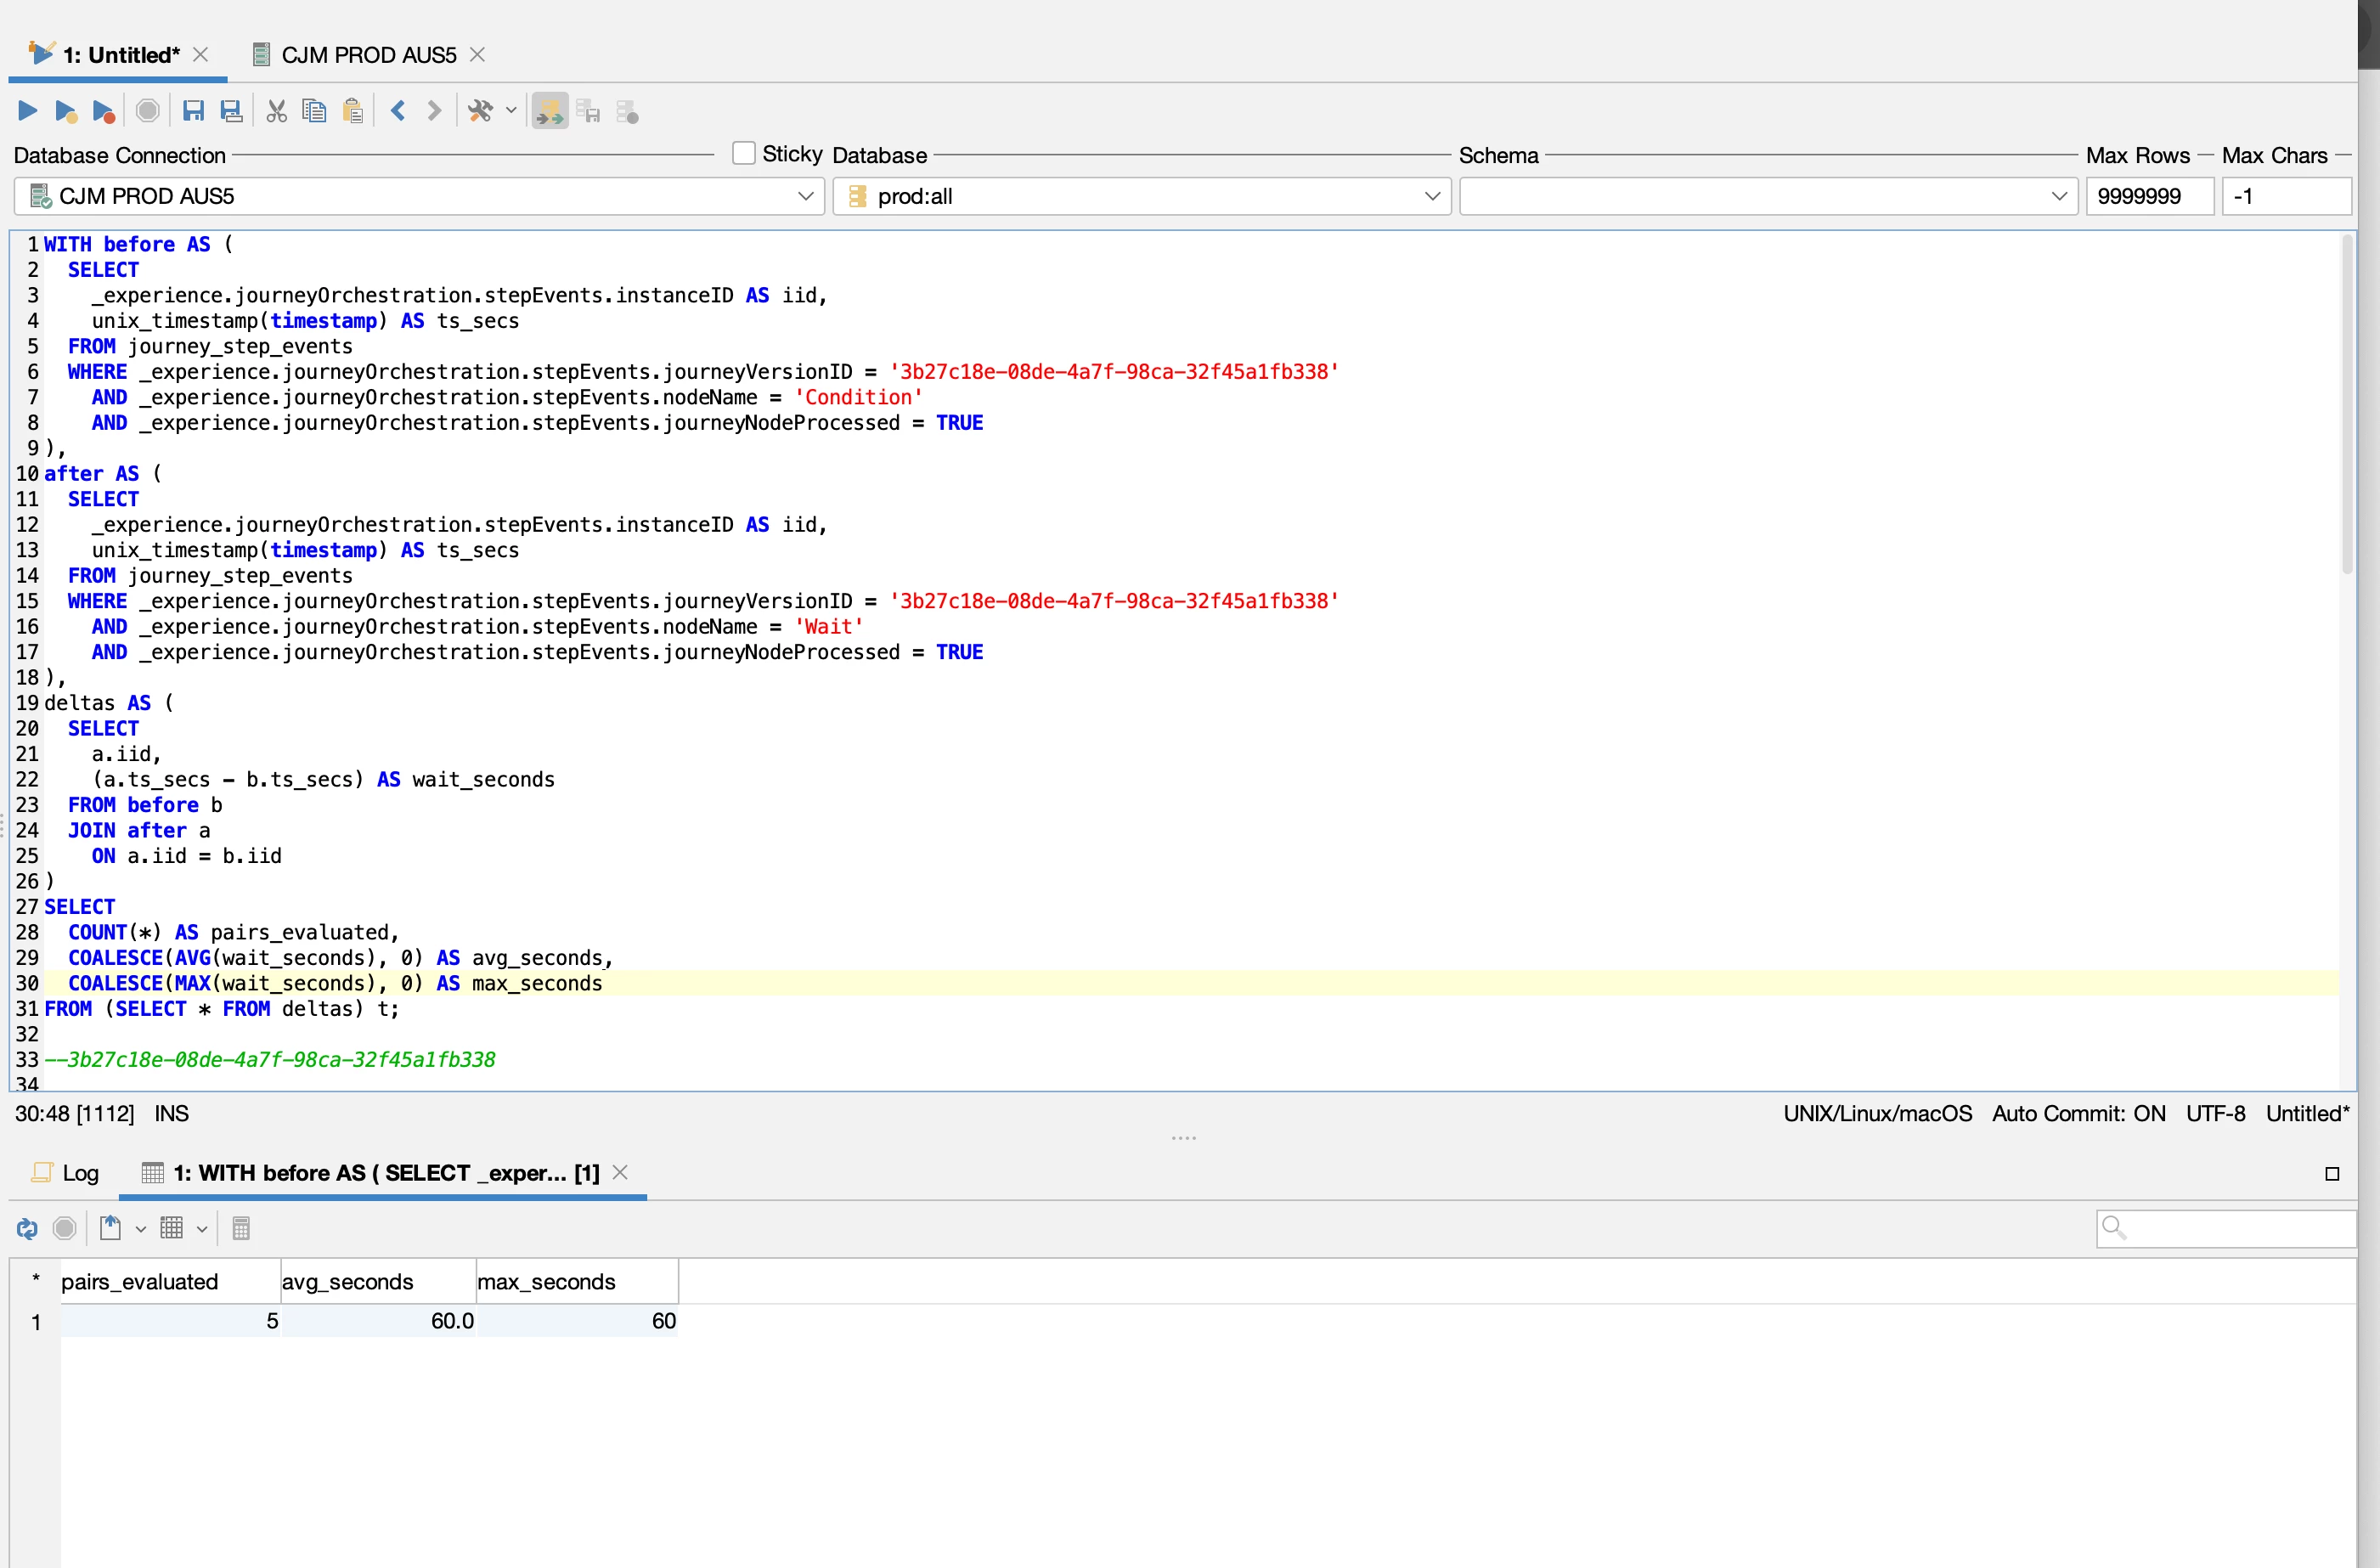
If max_seconds is near the Wait's configured timeout, consider splitting workloads.
iv) Rate-Limit Alert – Custom Action Capping
This query acts as a safety valve, alerting you if a custom action is hitting the platform's rate limits.
SELECT bucket_start,
       request_count
FROM (
  SELECT DATE_FORMAT(
           TO_TIMESTAMP(FLOOR(EXTRACT(EPOCH FROM timestamp)*1000/60000)*60000/1000),
           'yyyy-MM-dd HH:mm') AS bucket_start,
         COUNT(*)             AS request_count
  FROM   journey_step_events
  WHERE  _experience.journeyOrchestration.stepEvents.journeyVersionID = '<journeyVersionID>'
    AND  _experience.journeyOrchestration.stepEvents.nodeID = '<Action-NodeID>'
  GROUP  BY bucket_start) t
WHERE  request_count > 300000;  -- default platform cap per minute
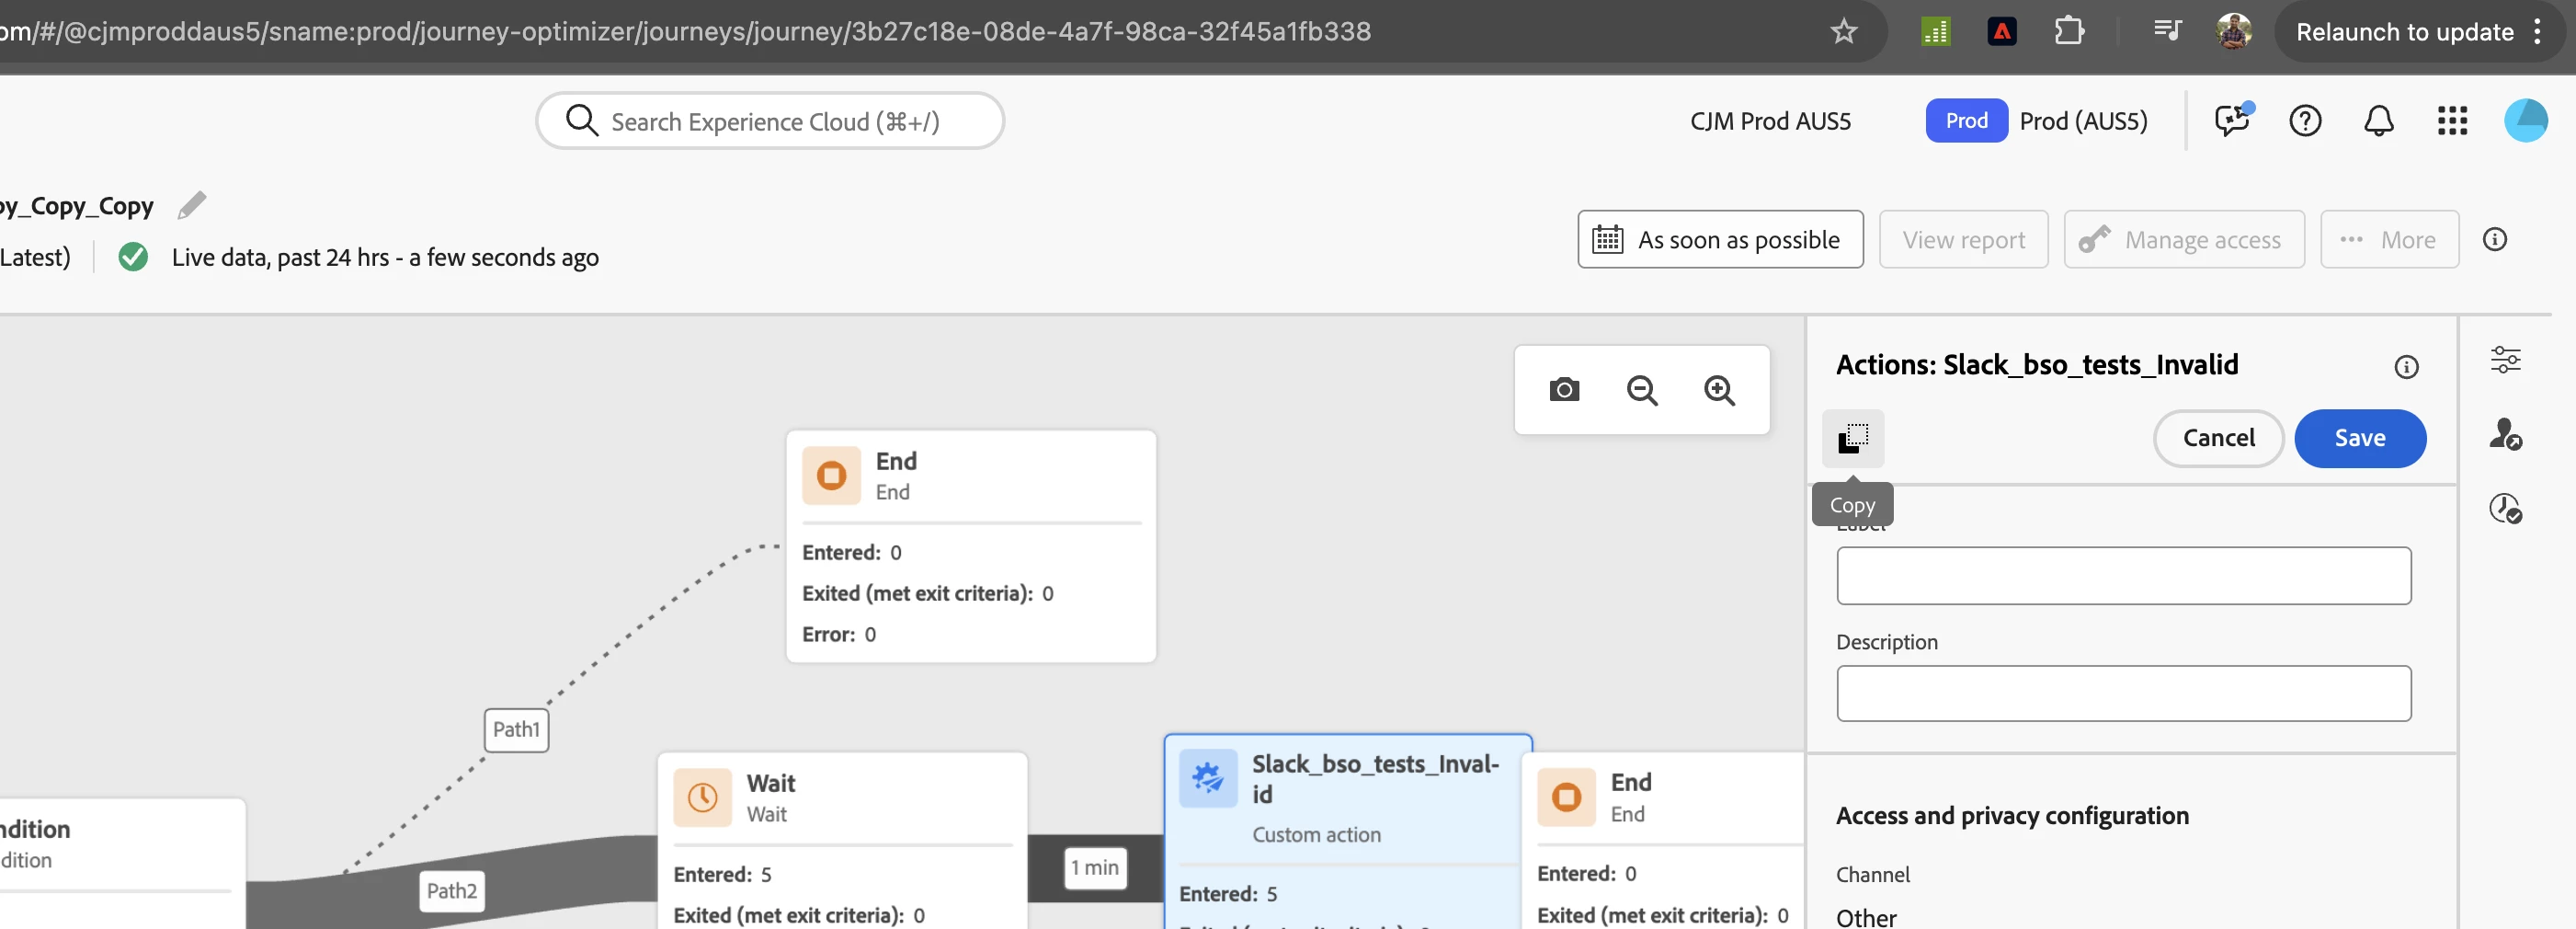
To get finer details of a node like nodeId, click copy button in node's form as shown in below image
Note: The 300 k/min figure is Adobe's default guard-rail. Always confirm the latest limits in the official Journey Optimizer Guardrails documentation.
v) Joining Email Feedback to Step Events
1) Locate the Dataset
In Experience Platform › Datasets look for AJO Message Feedback Event Dataset . Confirm it uses the Message Feedback Event schema.
Every feedback row carries messageExecution.journeyVersionID and emailChannelContext.address (or SMS fields). That's enough to relate back.
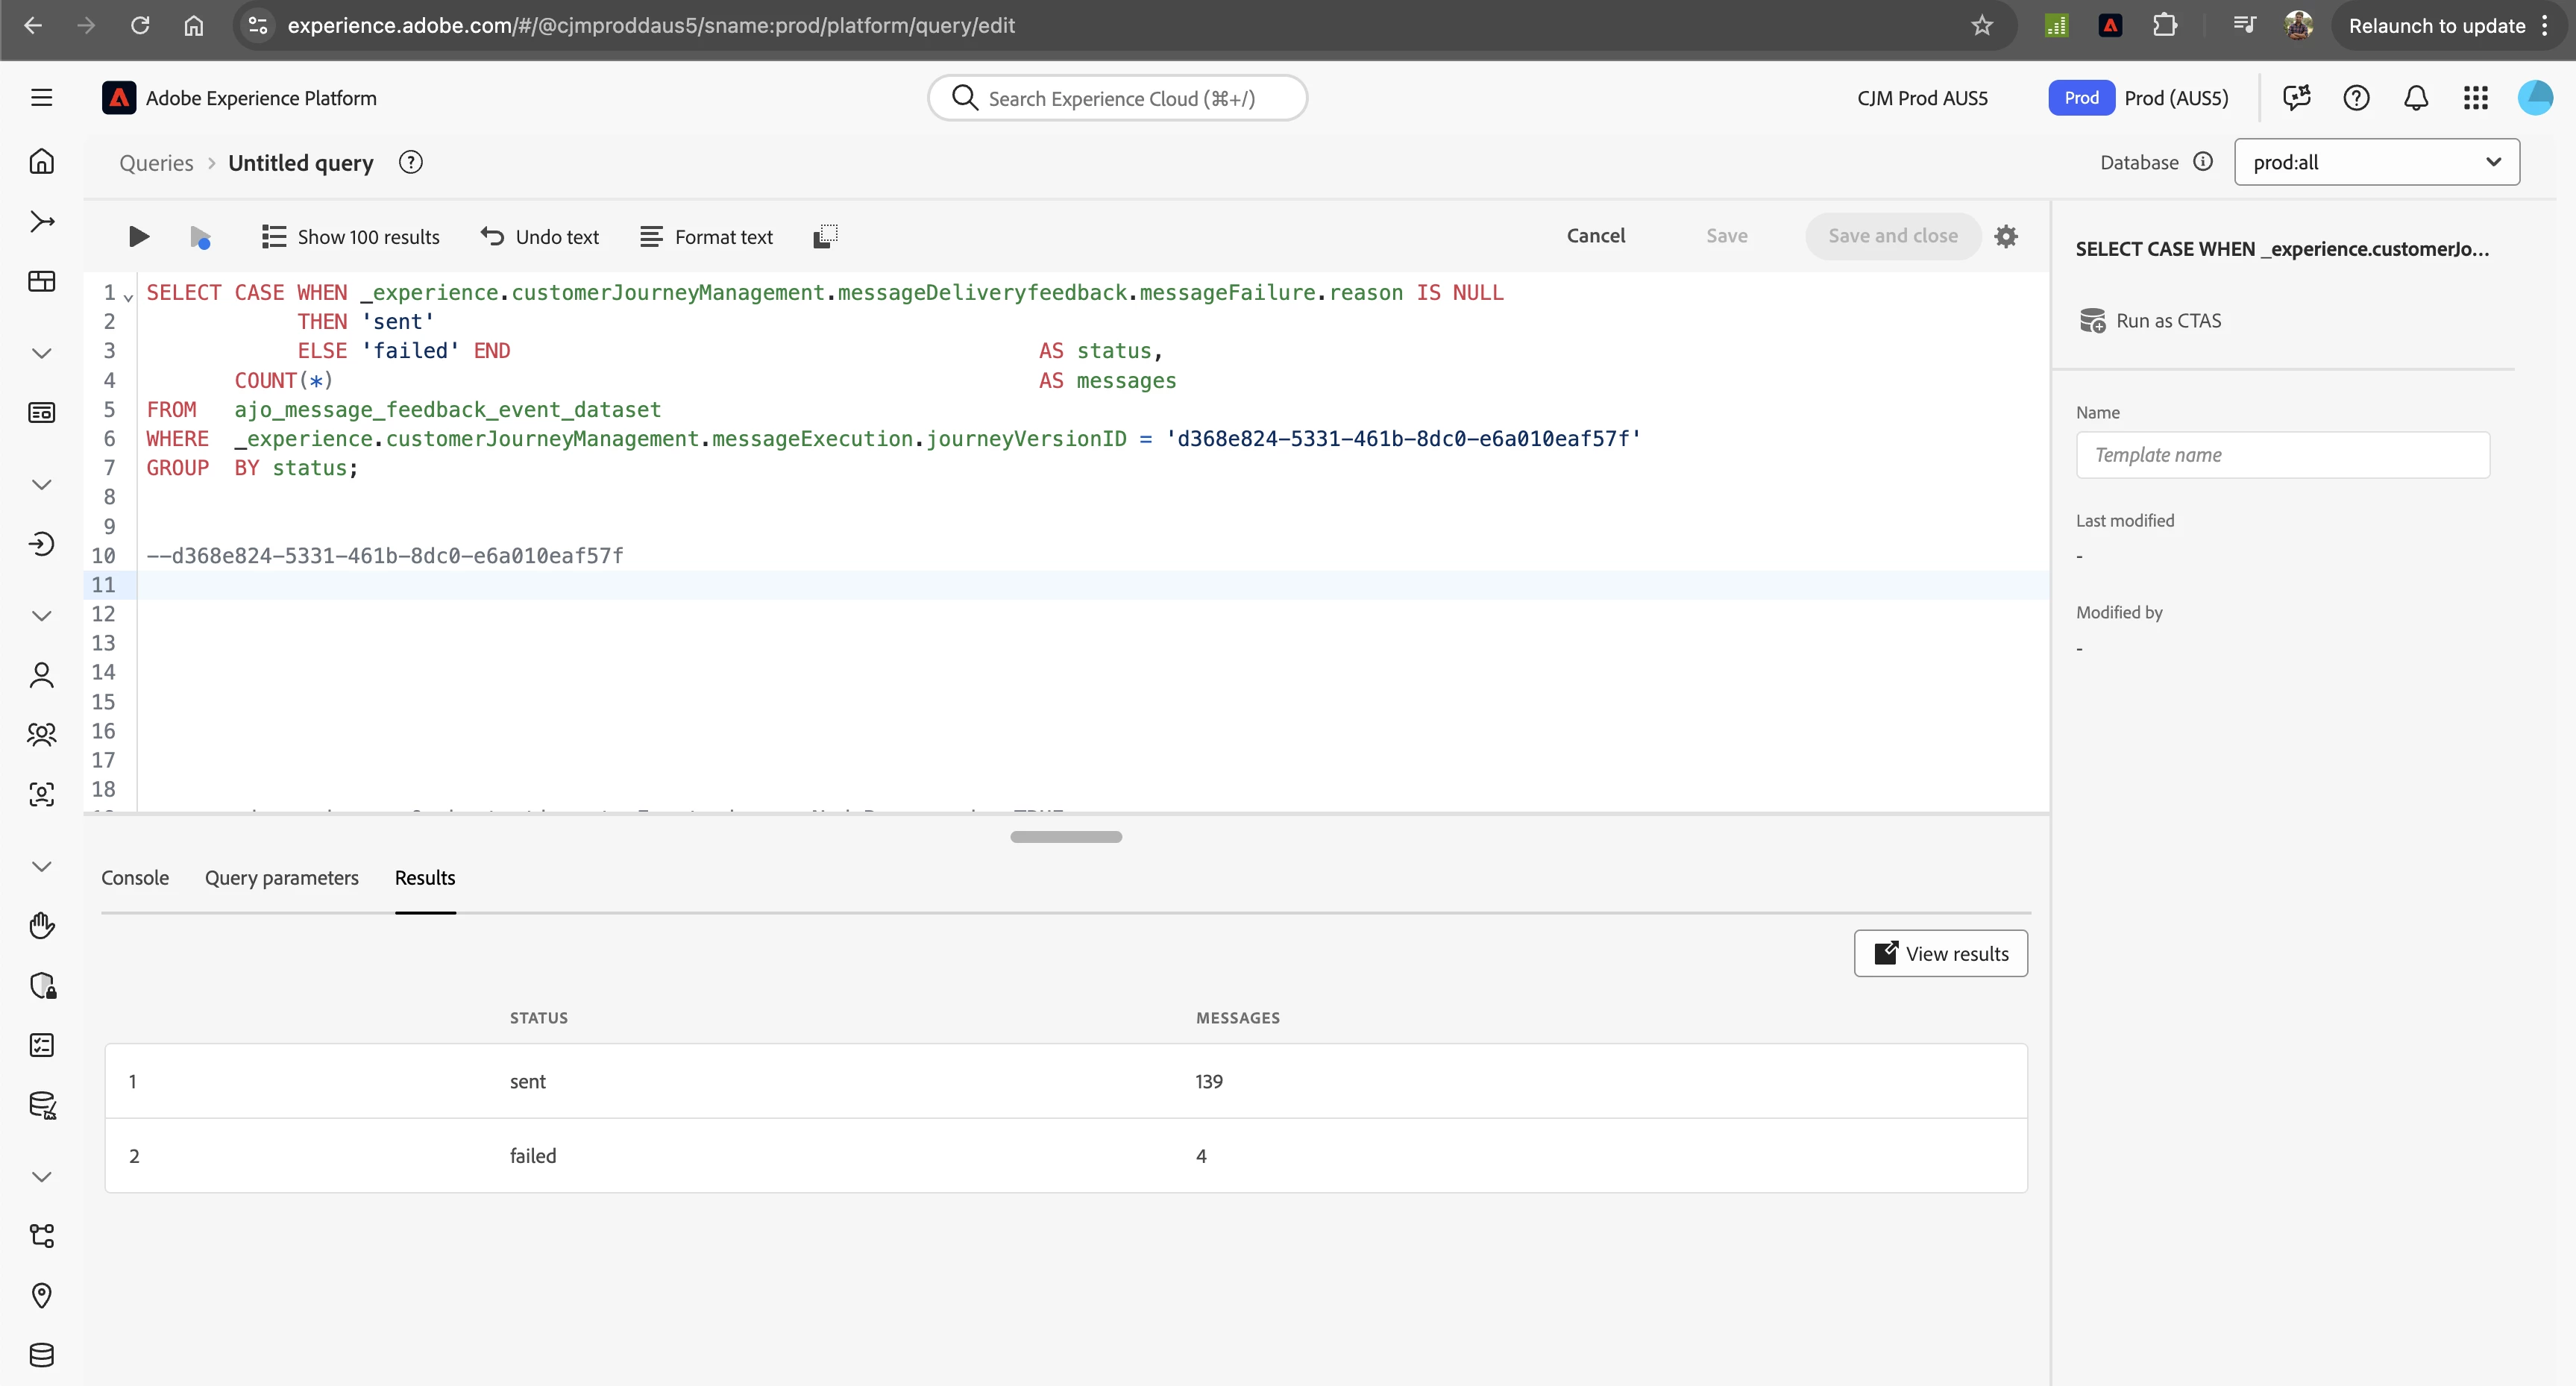
2) Sent vs. Failed for One Journey Version
Let's get the final delivery status from the messaging system itself: of all the messages AJO tried to send, how many were accepted versus failed?
SELECT CASE WHEN _experience.customerJourneyManagement.messageDeliveryfeedback.messageFailure.reason IS NULL
            THEN 'sent'
            ELSE 'failed' END                                          AS status,
       COUNT(*)                                                        AS messages
FROM   ajo_message_feedback_event_dataset
WHERE  _experience.customerJourneyManagement.messageExecution.journeyVersionID = '<journeyVersionID>'
GROUP  BY status;
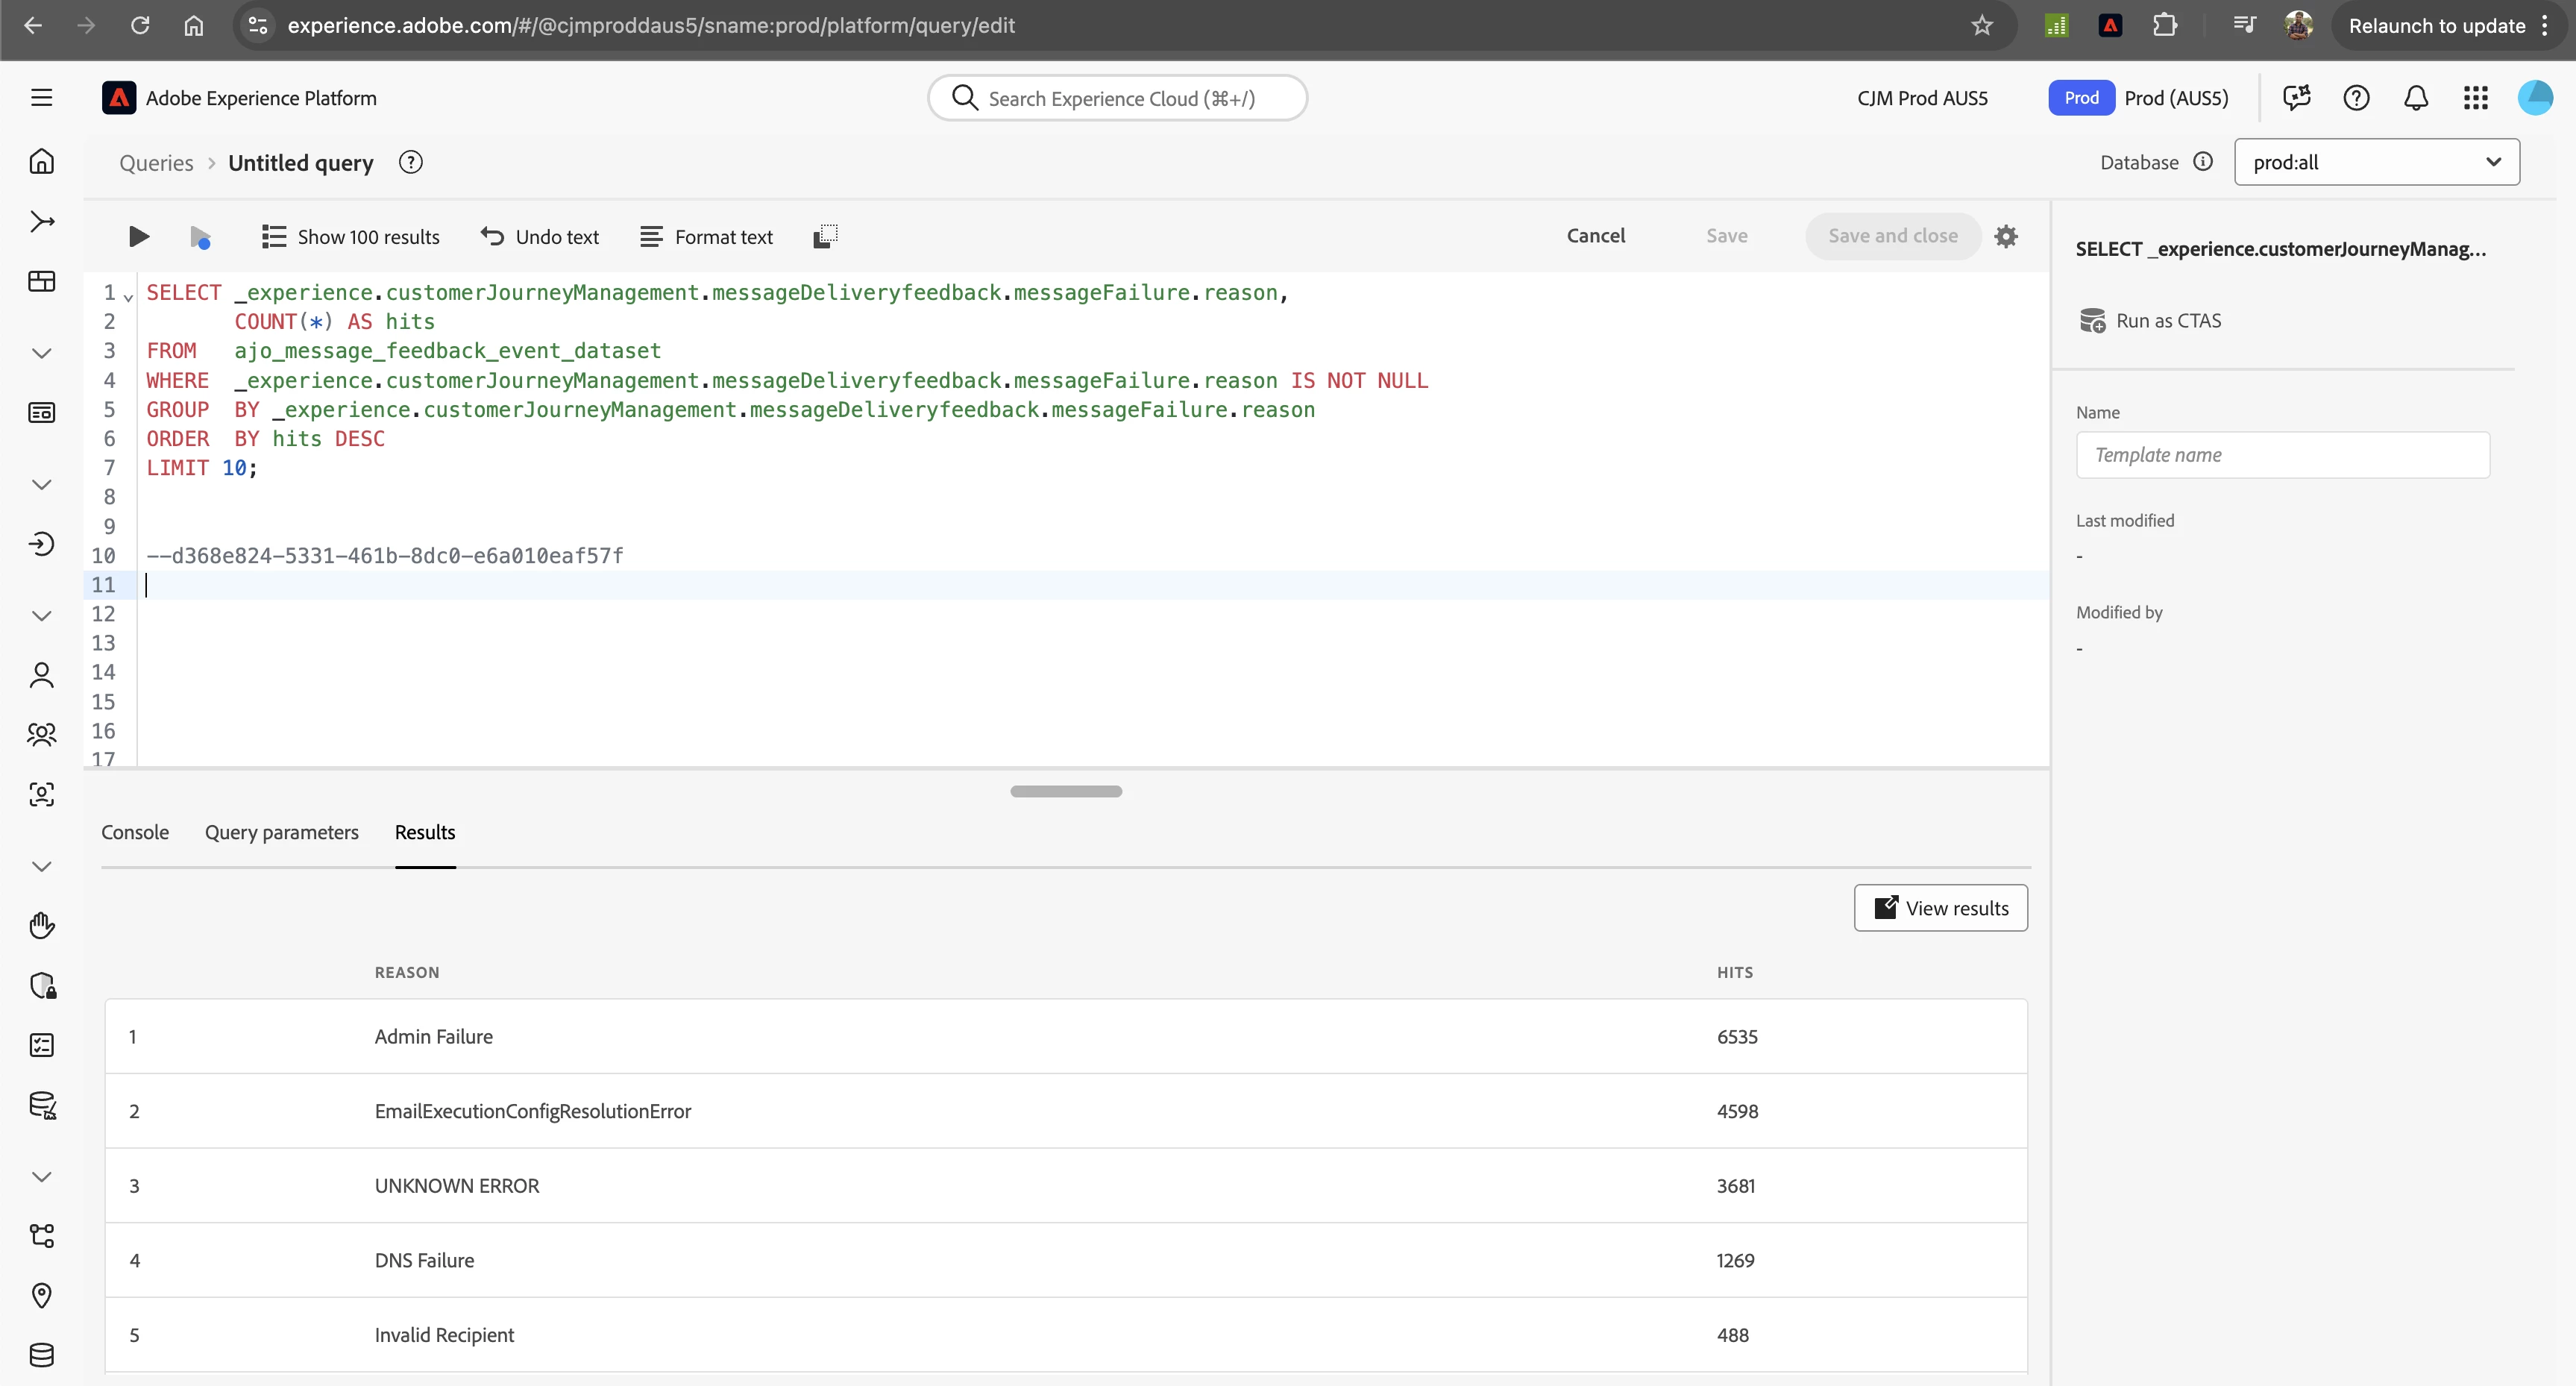
3) Top Failure Reasons Last 7 Days
For the messages that failed, this query provides the top bounce reasons, directly from the delivery provider.
SELECT _experience.customerJourneyManagement.messageDeliveryfeedback.messageFailure.reason,
       COUNT(*) AS hits
FROM   ajo_message_feedback_event_dataset
WHERE  timestamp > (NOW() - INTERVAL '7 day')
  AND  _experience.customerJourneyManagement.messageDeliveryfeedback.messageFailure.reason IS NOT NULL
GROUP  BY _experience.customerJourneyManagement.messageDeliveryfeedback.messageFailure.reason
ORDER  BY hits DESC
LIMIT 10;
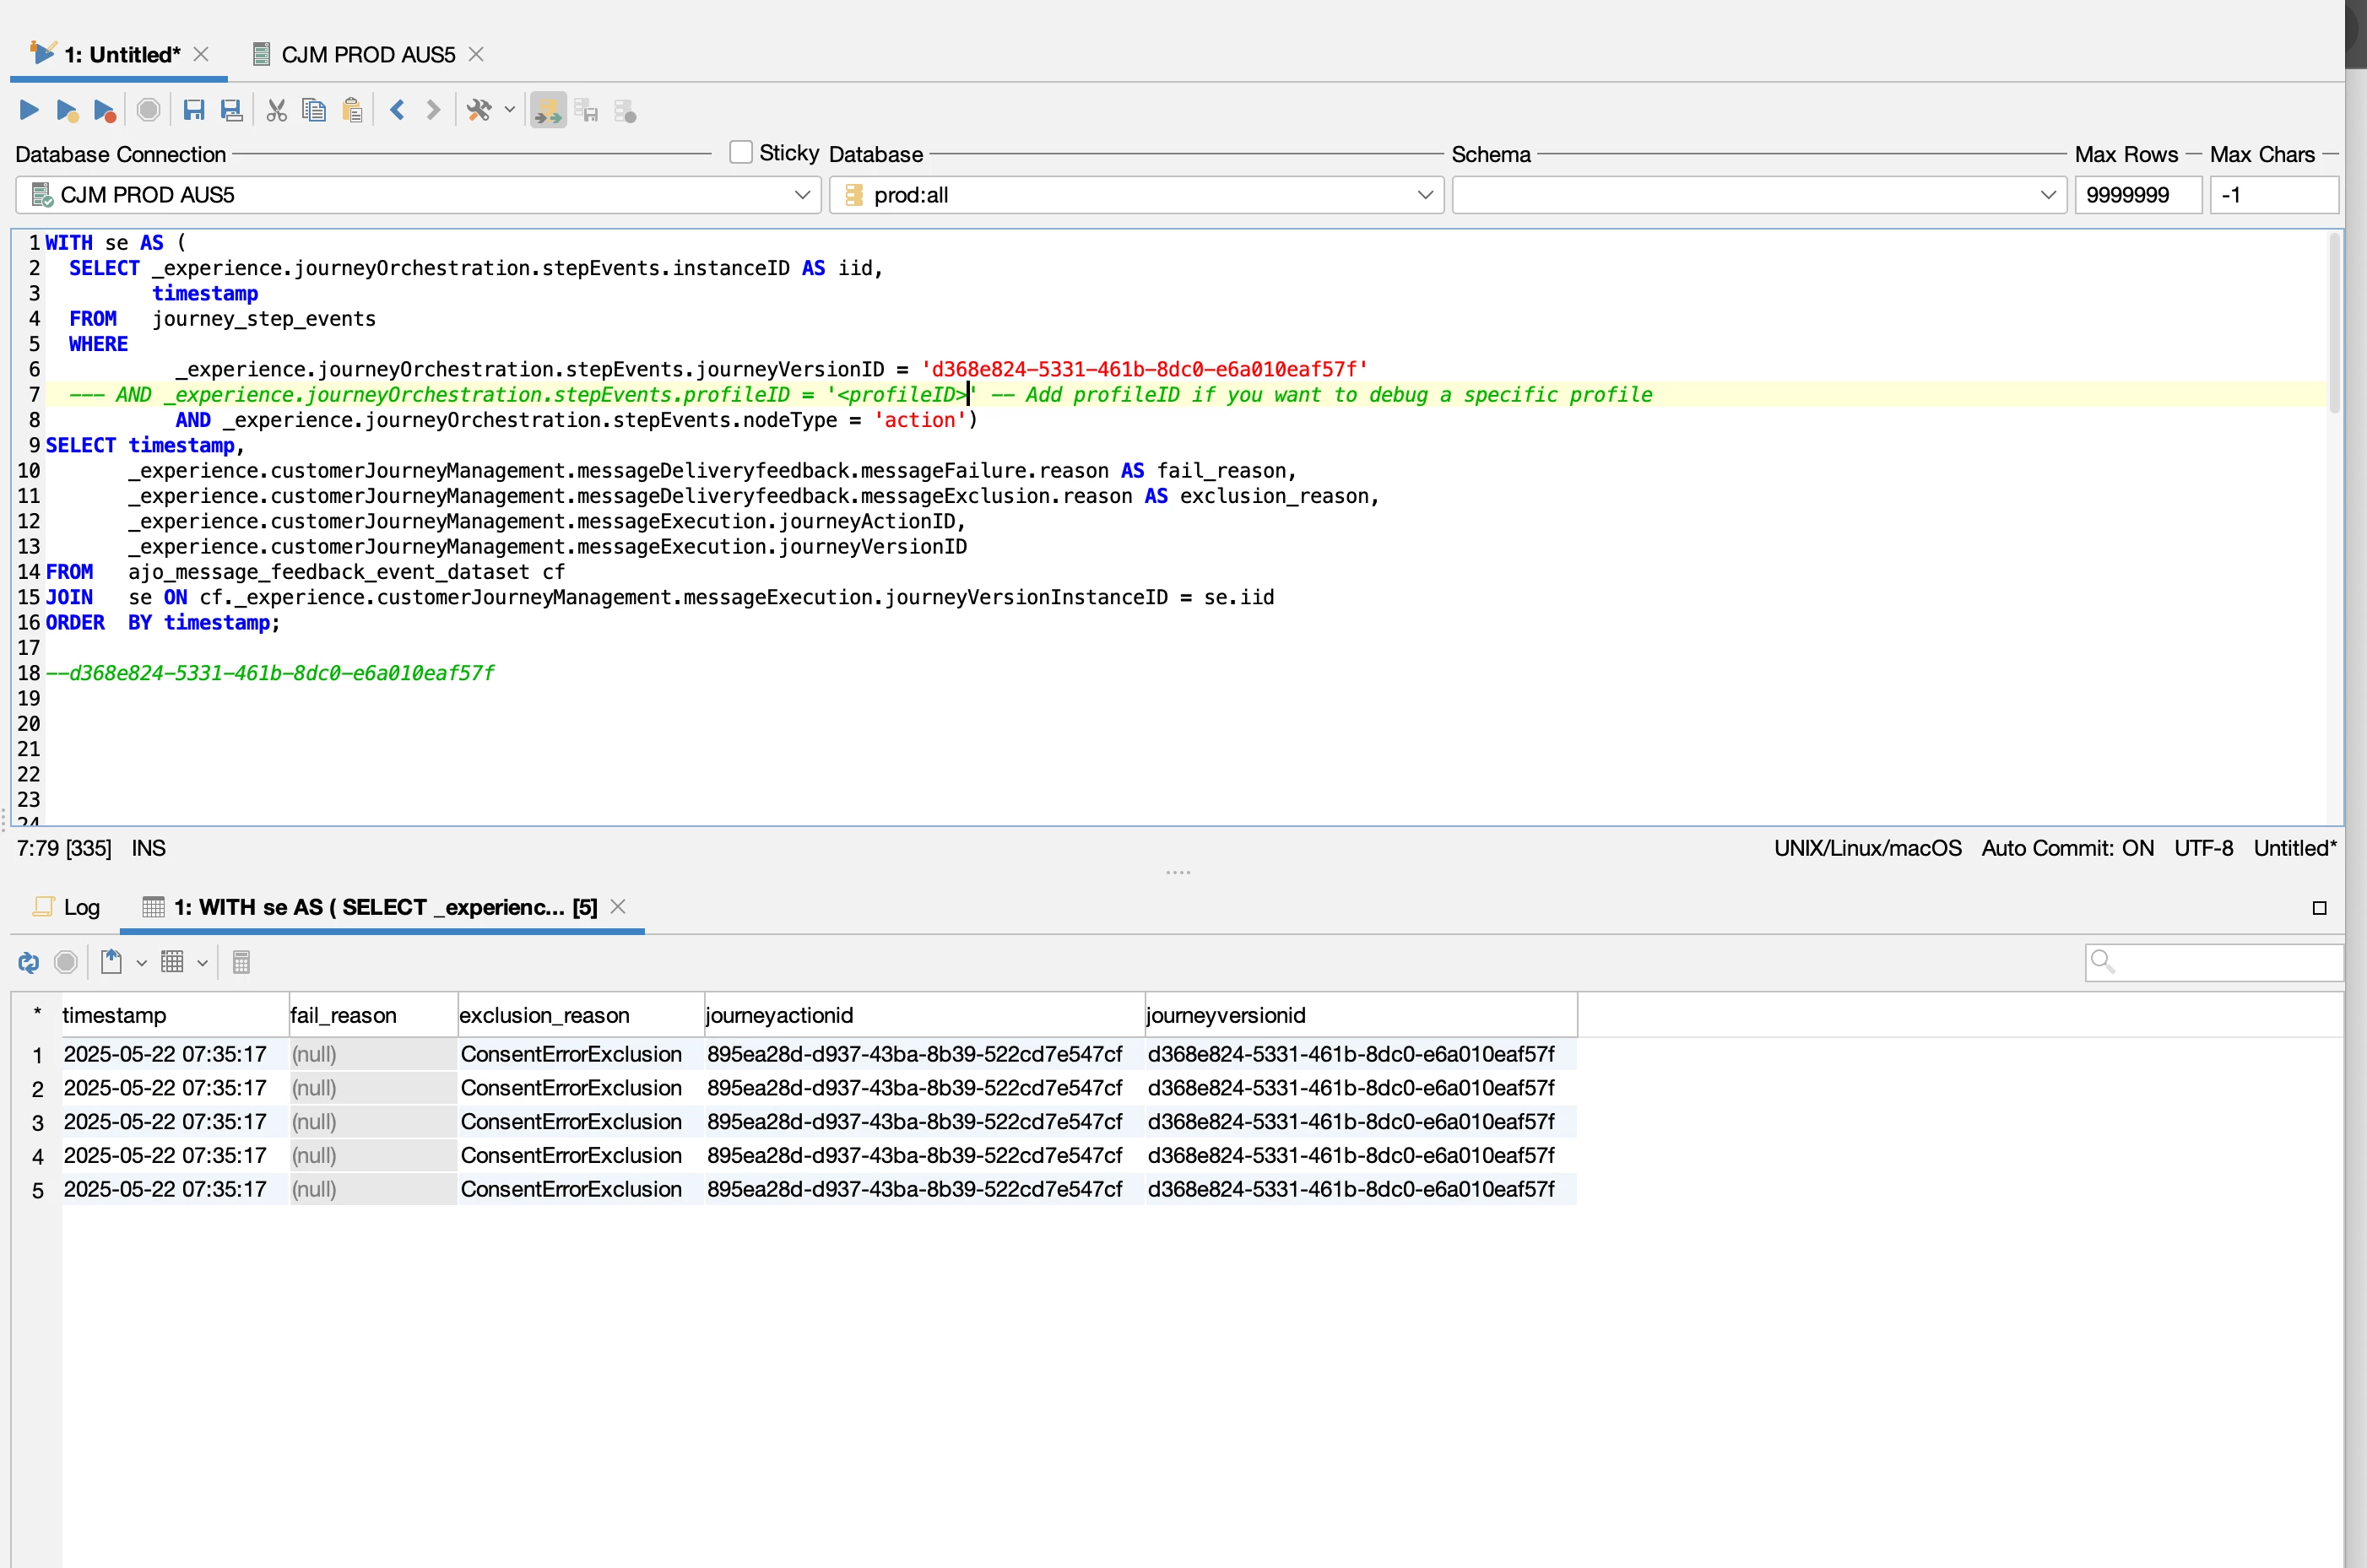
4) Trace a Single Profile End-to-End
Finally, let's connect the dots for a single user, tracing their path from a journey action all the way to the final delivery feedback.
-- First, capture Step Events instanceID
WITH se AS (
  SELECT _experience.journeyOrchestration.stepEvents.instanceID AS iid,
         timestamp
  FROM   journey_step_events
  WHERE  _experience.journeyOrchestration.stepEvents.journeyVersionID = '<journeyVersionID>'
    AND  _experience.journeyOrchestration.stepEvents.profileID = '<profileID>'
    AND  _experience.journeyOrchestration.stepEvents.nodeType = 'action')
SELECT timestamp,
       _experience.customerJourneyManagement.messageDeliveryfeedback.messageFailure.reason AS fail_reason,
       _experience.customerJourneyManagement.messageDeliveryfeedback.messageExclusion.reason AS exclusion_reason,
       _experience.customerJourneyManagement.messageExecution.journeyActionID,
       _experience.customerJourneyManagement.messageExecution.journeyVersionID
FROM   ajo_message_feedback_event_dataset cf
JOIN   se ON cf._experience.customerJourneyManagement.messageExecution.journeyVersionInstanceID = se.iid
ORDER  BY timestamp;
If Step Events report 10 000 action processed events but AJO shows only 9 500 sent , run the Top Failure Reasons query and map to provider logs.
Happy cross-validating!
Summary
You've now squeezed every ounce of performance insight out of Step Events— from daily active counts to per-minute throttle alerts, and even cross-validating with AJO delivery feedback.
Continue your journey: Mastering Step Events in Adobe Journey Optimizer: Fundamentals, Schema, and Essential Queries for Data-Driven Campaigns | Troubleshooting Step Events in Adobe Journey Optimizer: Diagnosing Errors, Discards, and Failures for Reliable Customer Journeys