

Monitoring Custom Actions in Adobe Journey Optimizer
Adobe Journey Optimizer (AJO) empowers brands to deliver personalized, real-time experiences across channels. Custom actions—external API calls triggered within journeys—are a powerful way to extend functionality. To ensure these actions perform reliably, Adobe provides a comprehensive monitoring dashboard. Using Adobe Journey Optimizer’s built-in reporting, you can visualize latency, error patterns, and API execution performance for custom actions across different environments.
Real world use cases with customers using AJO custom action monitoring:
- Financial analyst customer says: Enables their teams to detect and resolve issues more efficiently—critical for minimizing revenue loss and ensuring a seamless customer experience. Real-time visibility into integrations will streamline troubleshooting and compliance processes while supporting internal audit requirements. By accelerating issue identification and resolution, and continuously optimizing operational workflows, custom action monitoring is expected to reduce support costs and maximize the business value of their Adobe Journey Optimizer investment.
- Other industry customer says: Gains deeper visibility into faster issue detection and resolution of the 3rd party SMS provider integration that is triggered through the custom action feature. This is critical for minimizing revenue loss, complying with legally mandated campaigns such as Best-Tarif-Advice, and maintaining a seamless customer experience.
📄 Custom Action Monitoring – Queries and Definitions
📊 Total Calls, Errors, and RPS by Endpoint
SELECT
_experience.journeyOrchestration.stepEvents.actionOriginEndpoint AS ENDPOINT,
COUNT(1) AS TOTAL_CALLS,
COUNT(CASE WHEN _experience.journeyOrchestration.stepEvents.actionExecutionError IS NULL THEN 1 END) AS SUCCESSFUL_CALLS,
COUNT(CASE WHEN _experience.journeyOrchestration.stepEvents.actionExecutionError = 'http' AND _experience.journeyOrchestration.stepEvents.actionExecutionErrorCode LIKE '4%' THEN 1 END) AS "4xx_ERRORS",
COUNT(CASE WHEN _experience.journeyOrchestration.stepEvents.actionExecutionError = 'http' AND _experience.journeyOrchestration.stepEvents.actionExecutionErrorCode LIKE '5%' THEN 1 END) AS "5xx_ERRORS",
COUNT(CASE WHEN _experience.journeyOrchestration.stepEvents.actionExecutionError = 'timedout' THEN 1 END) AS TIMEOUTS,
COUNT(CASE WHEN _experience.journeyOrchestration.stepEvents.actionExecutionError = 'capped' THEN 1 END) AS CAPPED_CALLS,
ROUND(COUNT(_experience.journeyOrchestration.stepEvents.actionExecutionOriginStartTime) / COUNT(DISTINCT DATE_TRUNC('second', _experience.journeyOrchestration.stepEvents.actionExecutionOriginStartTime)), 0) AS THROUGHPUT_RPS
FROM journey_step_events
WHERE
_experience.journeyOrchestration.stepEvents.actionType = 'customHttpAction' AND
_experience.journeyOrchestration.stepEvents.actionOriginEndpoint IS NOT NULL AND
( OR (_experience.journeyOrchestration.stepEvents.actionExecutionError = 'capped' AND ))
GROUP BY ENDPOINT
ORDER BY ENDPOINT;
📈 Time Series of Calls, Errors, and Throughput
SELECT
_experience.journeyOrchestration.stepEvents.actionOriginEndpoint AS ENDPOINT,
DATE_FORMAT(COALESCE(_experience.journeyOrchestration.stepEvents.actionExecutionOriginStartTime, timestamp), 'yyyy/MM/dd HH:mm') AS SPAN,
COUNT(1) AS TOTAL_CALLS,
COUNT(CASE WHEN _experience.journeyOrchestration.stepEvents.actionExecutionError IS NULL THEN 1 END) AS SUCCESSFUL_CALLS,
COUNT(CASE WHEN _experience.journeyOrchestration.stepEvents.actionExecutionError = 'http' AND _experience.journeyOrchestration.stepEvents.actionExecutionErrorCode LIKE '4%' THEN 1 END) AS "4xx_ERRORS",
COUNT(CASE WHEN _experience.journeyOrchestration.stepEvents.actionExecutionError = 'http' AND _experience.journeyOrchestration.stepEvents.actionExecutionErrorCode LIKE '5%' THEN 1 END) AS "5xx_ERRORS",
COUNT(CASE WHEN _experience.journeyOrchestration.stepEvents.actionExecutionError = 'timedout' THEN 1 END) AS TIMEOUTS,
COUNT(CASE WHEN _experience.journeyOrchestration.stepEvents.actionExecutionError = 'capped' THEN 1 END) AS CAPPED_CALLS,
ROUND(COUNT(_experience.journeyOrchestration.stepEvents.actionExecutionOriginStartTime) / COUNT(DISTINCT DATE_TRUNC('second', _experience.journeyOrchestration.stepEvents.actionExecutionOriginStartTime)), 0) AS THROUGHPUT_RPS
FROM journey_step_events
WHERE
_experience.journeyOrchestration.stepEvents.actionType = 'customHttpAction' AND
_experience.journeyOrchestration.stepEvents.actionOriginEndpoint IS NOT NULL AND
( OR (_experience.journeyOrchestration.stepEvents.actionExecutionError = 'capped' AND ))
GROUP BY ENDPOINT, SPAN
ORDER BY ENDPOINT, SPAN;
⏱️ Latency Percentiles by Endpoint
SELECT
_experience.journeyOrchestration.stepEvents.actionOriginEndpoint AS ENDPOINT,
COUNT(1) AS SUCCESSFUL_CALLS,
ROUND(PERCENTILE_CONT(0.50) WITHIN GROUP (ORDER BY _experience.journeyOrchestration.stepEvents.actionExecutionOriginTime), 0) AS P50_LATENCY_MS,
ROUND(PERCENTILE_CONT(0.95) WITHIN GROUP (ORDER BY _experience.journeyOrchestration.stepEvents.actionExecutionOriginTime), 0) AS P95_LATENCY_MS,
ROUND(PERCENTILE_CONT(0.99) WITHIN GROUP (ORDER BY _experience.journeyOrchestration.stepEvents.actionExecutionOriginTime), 0) AS P99_LATENCY_MS,
ROUND(PERCENTILE_CONT(0.999) WITHIN GROUP (ORDER BY _experience.journeyOrchestration.stepEvents.actionExecutionOriginTime), 0) AS P999_LATENCY_MS
FROM journey_step_events
WHERE
_experience.journeyOrchestration.stepEvents.actionType = 'customHttpAction' AND
_experience.journeyOrchestration.stepEvents.actionOriginEndpoint IS NOT NULL AND
_experience.journeyOrchestration.stepEvents.actionExecutionError IS NULL AND
_experience.journeyOrchestration.stepEvents.actionExecutionOriginTime IS NOT NULL

GROUP BY ENDPOINT
ORDER BY ENDPOINT;
🚨 Error Breakdown by Type and Code
SELECT
_experience.journeyOrchestration.stepEvents.actionExecutionError AS ERROR_TYPE,
_experience.journeyOrchestration.stepEvents.actionExecutionErrorCode AS ERROR_CODE,
COUNT(1) AS CALLS,
COUNT(CASE WHEN _experience.journeyOrchestration.stepEvents.actionExecutionOriginError IS NOT NULL THEN 1 END) AS CALLS_WITH_RETRY
FROM journey_step_events
WHERE
_experience.journeyOrchestration.stepEvents.actionType = 'customHttpAction' AND
_experience.journeyOrchestration.stepEvents.actionOriginEndpoint = '' AND
_experience.journeyOrchestration.stepEvents.actionExecutionError IS NOT NULL AND
( OR (_experience.journeyOrchestration.stepEvents.actionExecutionError = 'capped' AND ))
GROUP BY ERROR_TYPE, ERROR_CODE
ORDER BY ERROR_TYPE, ERROR_CODE;
📉 Average Latency and Wait Time
-- Average Latency
SELECT
_experience.journeyOrchestration.stepEvents.actionOriginEndpoint AS ENDPOINT,
SUM(_experience.journeyOrchestration.stepEvents.actionExecutionOriginTime) / COUNT(_experience.journeyOrchestration.stepEvents.actionExecutionOriginTime) AS Average_Latency
FROM journey_step_events
WHERE
_experience.journeyOrchestration.stepEvents.actionType = 'customHttpAction' AND
_experience.journeyOrchestration.stepEvents.actionOriginEndpoint IS NOT NULL AND
_experience.journeyOrchestration.stepEvents.actionExecutionOriginTime IS NOT NULL AND

GROUP BY ENDPOINT;

-- Average Wait Time
SELECT
_experience.journeyOrchestration.stepEvents.actionOriginEndpoint AS ENDPOINT,
SUM(_experience.journeyOrchestration.stepEvents.actionWaitTime) / COUNT(_experience.journeyOrchestration.stepEvents.actionWaitTime) AS Average_Wait_Time
FROM journey_step_events
WHERE
_experience.journeyOrchestration.stepEvents.actionType = 'customHttpAction' AND
_experience.journeyOrchestration.stepEvents.actionOriginEndpoint IS NOT NULL AND
_experience.journeyOrchestration.stepEvents.actionWaitTime IS NOT NULL AND
_experience.journeyOrchestration.stepEvents.actionIsThrottled = 'true' AND

GROUP BY ENDPOINT;
🧩 Custom Action Metrics
This section provides a high-level summary of custom action performance across all endpoints and journeys over a selected time range.
The layout is designed to give users flexible control over how they view and analyze custom action performance—whether by endpoint, journey, or time frame.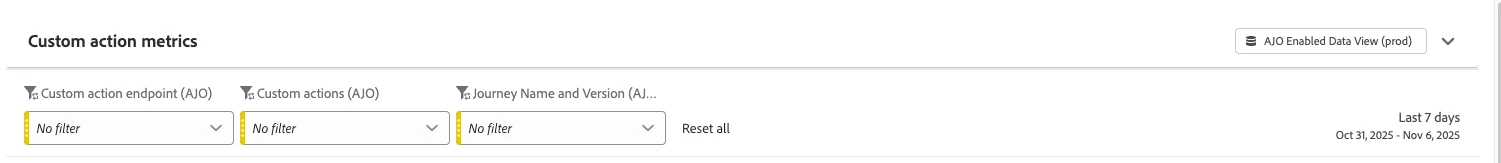
This interface provides a configurable workspace for analyzing custom action performance across endpoints, actions, and journey versions. It includes:
- Filter Controls: Users can select specific custom action endpoints, individual actions, and journey names/versions from dropdown menus to isolate and examine targeted segments of operational data.
- Reset Option: Quickly clear all applied filters with the “Reset all” button to return to the default view.
- Date Range Selector: Users can define the analysis window, such as the last 7 days, to focus on recent activity and trends.
- Data View Toggle: Generate reports from a production-level data view within Adobe Journey Optimizer (AJO).
💡 This panel is designed to help users tailor their analysis, monitor performance across different dimensions, and maintain reliable integrations within their journeys.
🧭 Custom Action KPIs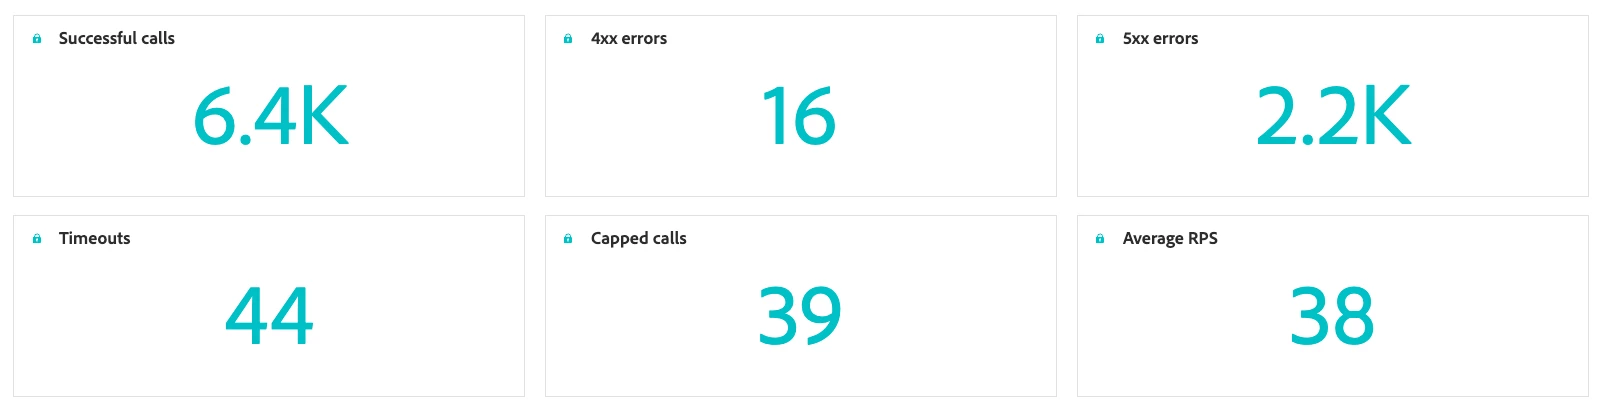
The Custom Action Key Performance Indicators (KPIs) provide a unified monitoring surface within Adobe Journey Optimizer, offering real-time visibility into the operational integrity of your custom action executions. These metrics empower journey architects and marketers to assess delivery success, detect anomalies, and maintain seamless connectivity with external endpoints—ensuring reliable orchestration across personalized customer journeys.
-
Successful Calls: Displays the total number of API requests that were processed and returned a valid response without errors.
-
4xx Errors: Shows the count of client-side errors, typically caused by malformed requests, unauthorized access, or missing parameters.
-
5xx Errors: Indicates the number of server-side failures, such as internal errors or service unavailability, which suggest issues within the API infrastructure.
-
Timeouts: Tracks how many API requests exceeded the allowed response time and were terminated before completion.
-
Capped Calls: Reflects the number of requests that were restricted due to rate limits, quotas, or other throttling mechanisms.
-
Average RPS (Requests Per Second): Measures the average throughput of the API, providing insight into how many requests are being handled per second over a given time window.
💡 Use these metrics to identify systemic issues and validate endpoint reliability.
📈 Calls Over Time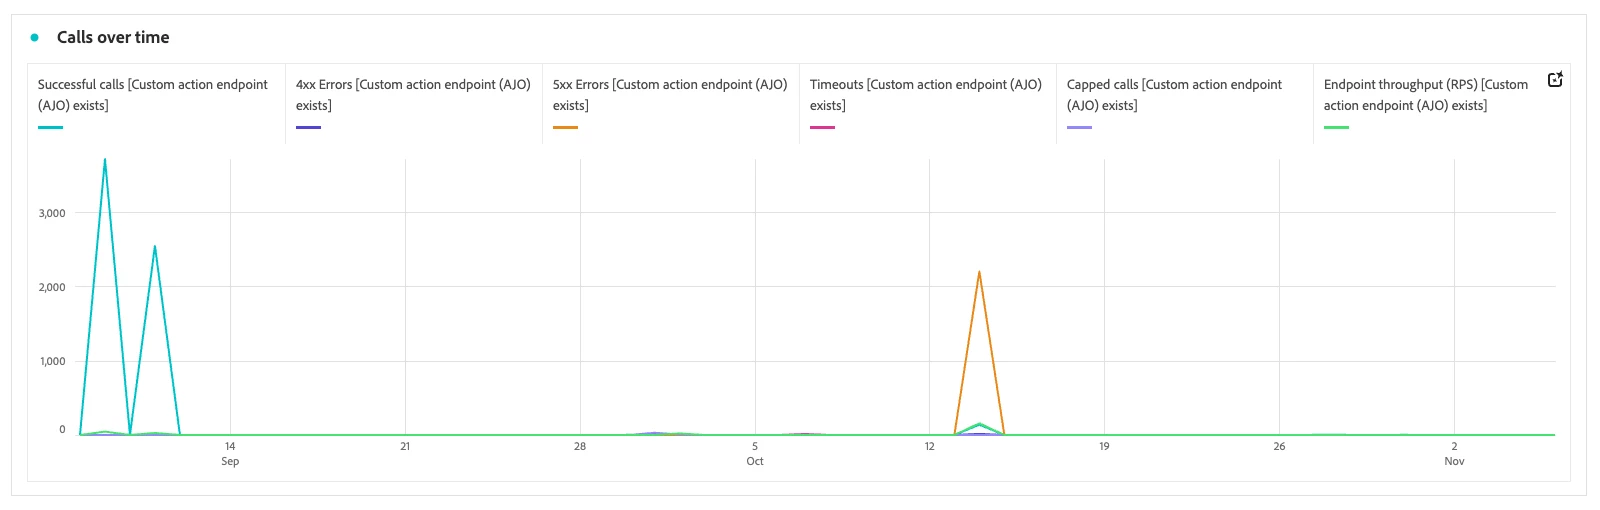
This visualization presents a time-series view of custom action activity within Adobe Journey Optimizer. It tracks multiple operational indicators across a defined date range, helping teams monitor endpoint behavior and performance fluctuations.
Each line represents a distinct KPI:
-
Successful Calls: Reflects the volume of custom actions that completed without error.
-
4xxErrors: Captures failed executions due to client-side or server-side issues.
-
5xxErrors: Indicates the total number of custom actions dispatched, regardless of outcome.
-
Timeouts: Highlights instances where custom actions exceeded the allowable response window.
-
Capped Calls: Represents requests that were throttled due to rate limits or quota restrictions.
-
Endpoint Throughput (RPS):It's a key performance metric that helps you understand how efficiently your endpoint handles traffic.
💡 Use this view to pinpoint when and where issues occurred, and validate fixes or optimizations.
📊 Call Breakdown
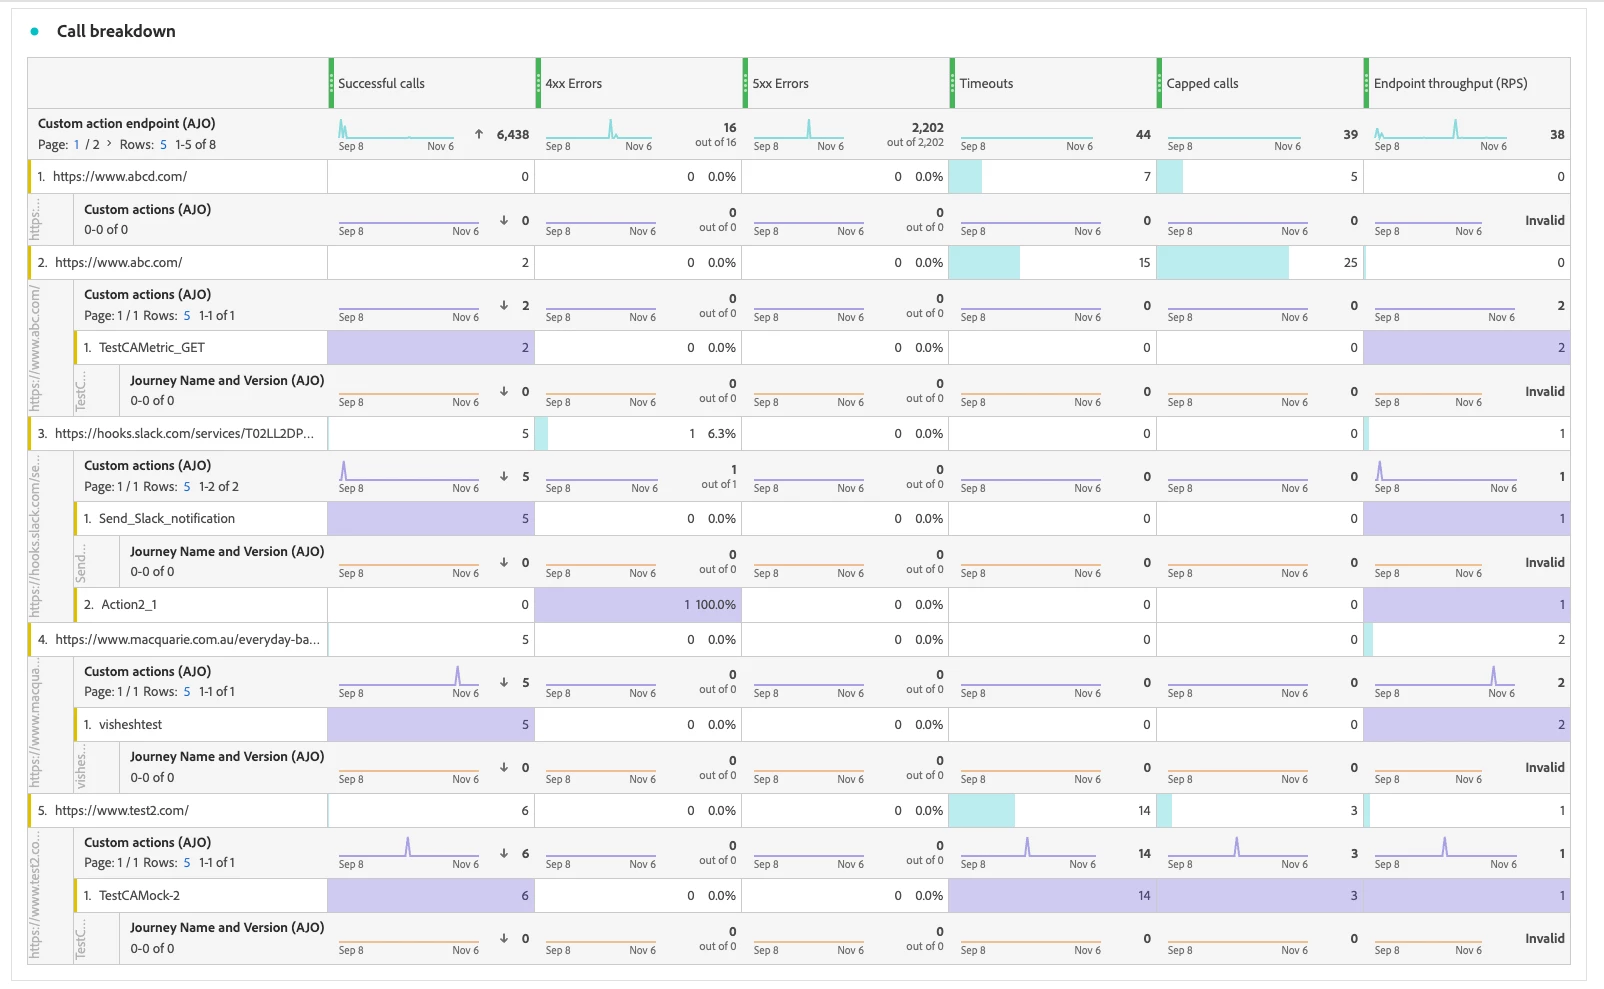
This dashboard provides a granular view of custom action performance across multiple dimensions. Organized in a tabular format, it categorizes rows by endpoint type—such as custom action endpoints, individual custom actions, and journey-level identifiers—allowing users to drill into specific execution contexts.
Each row represents a unique integration point or journey element, while columns display key performance indicators:
-
Successful Calls: Indicates the number of custom actions that completed successfully.
-
4xx Errors: Reflects client-side issues such as invalid requests or authorization failures.
-
5xx Errors: Captures server-side failures impacting delivery reliability.
-
Timeouts: Highlights calls that exceeded the response time threshold.
-
Capped Calls: Shows requests that were throttled due to rate limits or quotas.
-
Endpoint Throughput (RPS): Measures the average request rate, helping assess endpoint responsiveness. This metric is typically calculated per endpoint (URL path or API route) over a given time window.
💡 Use this breakdown to debug specific endpoints and understand how journeys interact with external systems.
⏱️️ Latency Metrics
Latency metrics help assess the responsiveness of custom action endpoints.

This interface provides a workspace for analyzing latency performance of custom actions over a selected time range. It includes:
-
Time Range Selector: Allows users to define the analysis window, such as the last 7 days, to focus on recent performance trends.
-
Filter Controls: Enables segmentation of data using custom filters. The “My filter” section lets users refine the view, and the “Reset all” option clears applied filters.
-
Segment Drop Zone: A placeholder labeled “Drop segments here for any other ungrouped” invites users to drag and drop segments for comparative analysis.
💡 Use latency data to optimize endpoint configurations, payload sizes, and retry logic.
⏱️ Latency Over Time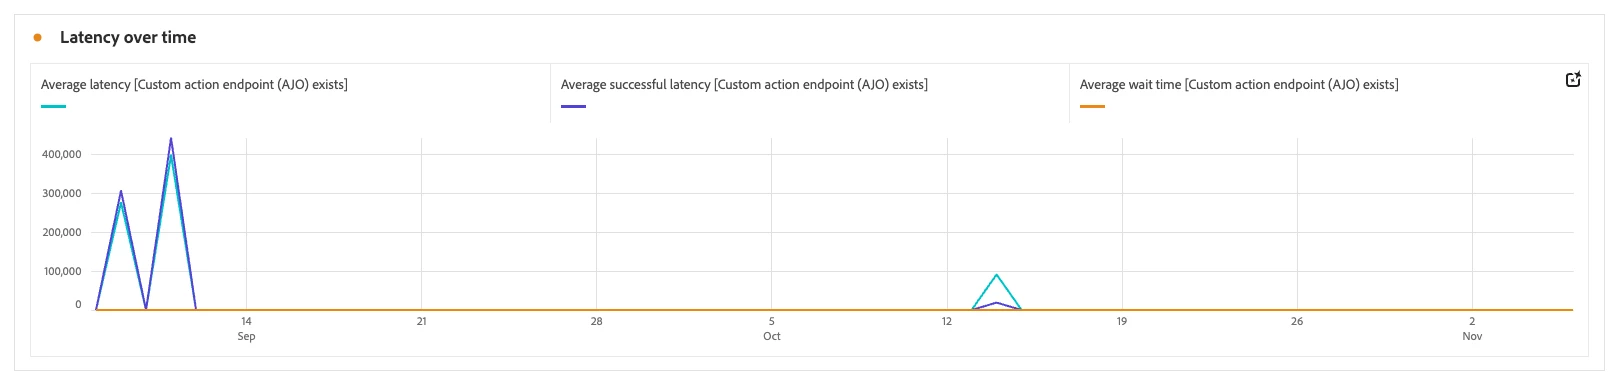
This time-series graph visualizes latency trends for custom action endpoints, helping users monitor responsiveness and identify performance bottlenecks. It includes three distinct metrics:
-
Average Latency: Represents the overall time taken for custom actions to complete, including both successful and failed attempts.
-
Average Successful Latency: Focuses specifically on the latency of successfully executed custom actions, offering a cleaner view of endpoint efficiency.
-
Average Wait Time: Captures the duration spent waiting before the action begins processing, which can indicate queuing or throttling delays.
💡 The x-axis spans a multi-week timeline, while the y-axis reflects latency in milliseconds. This visualization helps pinpoint periods of degraded performance, latency spikes, or improvements, enabling teams to optimize endpoint behavior and maintain smooth journey execution.
🧮 Latency Breakdown
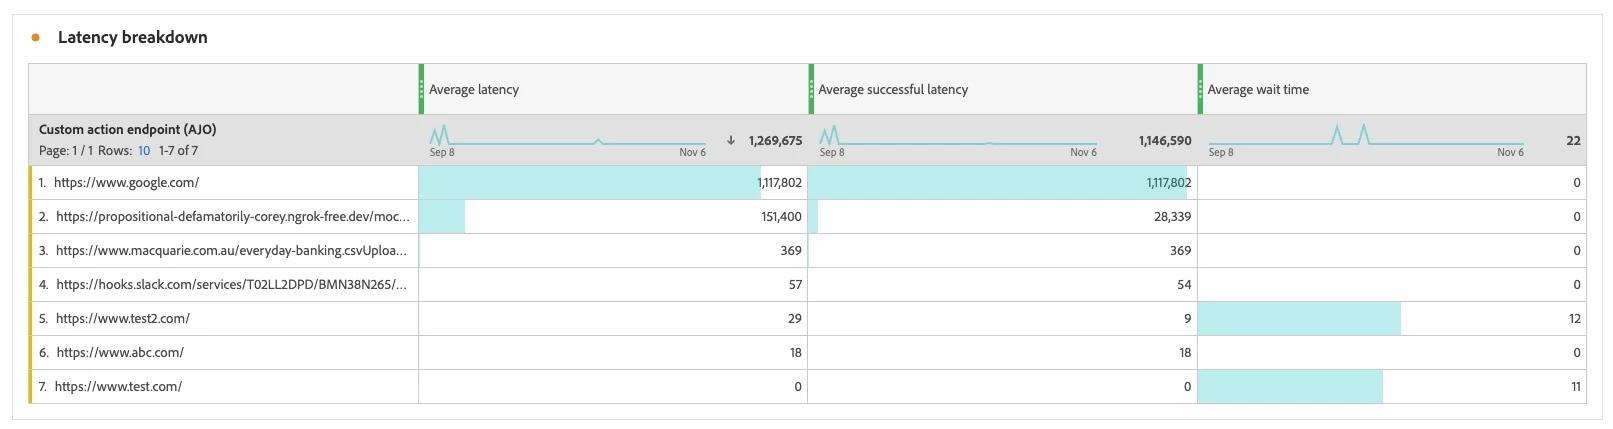
This dashboard presents a tabular view of latency metrics for various custom action endpoints. Each row corresponds to a distinct endpoint, while the columns represent key latency indicators:
-
Average Latency: Measures the total time taken for custom actions to complete, including all outcomes.
-
Average Successful Latency: Focuses specifically on the latency of successfully executed actions, offering insight into endpoint efficiency.
-
Average Wait Time: Captures the duration between request initiation and processing start, helping identify queuing or throttling delays.
💡 Visual bar indicators within each cell provide quick, comparative insights across endpoints. This breakdown helps users pinpoint high-latency endpoints, optimize response times, and maintain smooth journey execution.
🧠 Insight Builder
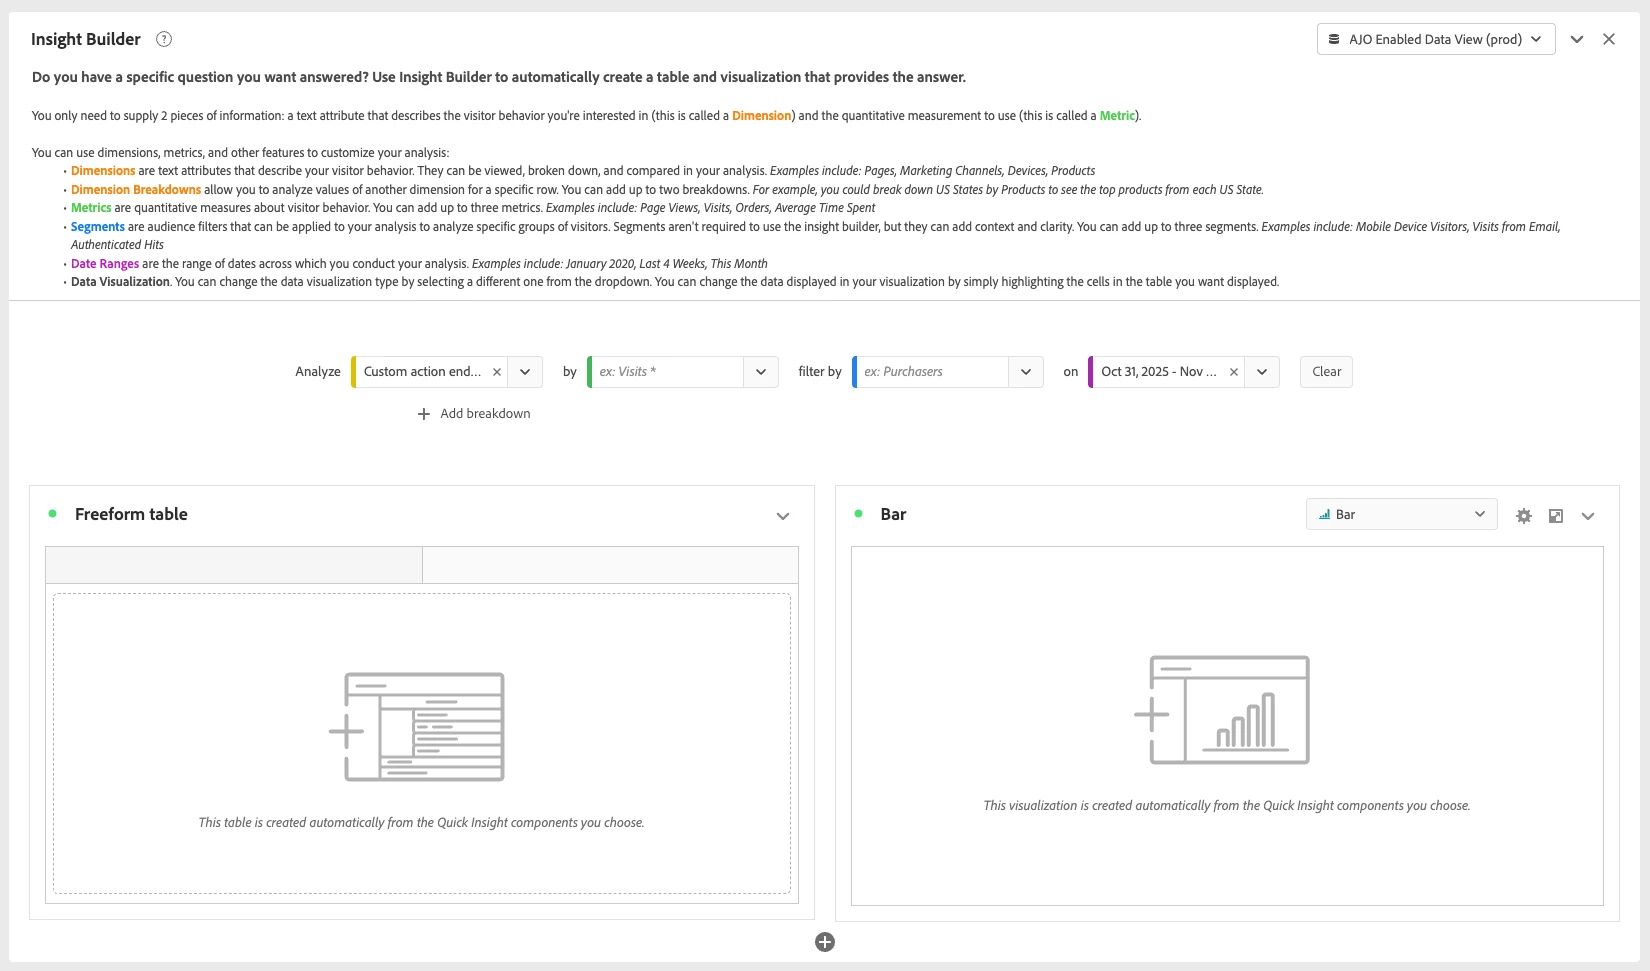
This interface provides a guided workspace for generating visual insights based on custom action metrics. It allows users to define analytical parameters and automatically generate visualizations and tables to explore performance trends.
Key Components:
-
Instructional Header: Offers tips on how to specify a question, apply breakdowns, and choose visualization types.
-
Analysis Controls:
-
Analyze: Selects the metric or dimension to evaluate (e.g., custom actions, counts).
-
Break Down By: Enables segmentation by attributes such as audience or behavior.
-
Date Range Selector: Defines the time window for analysis.
-
Add Breakdown: Allows further granularity by adding additional dimensions.
-
Detailed Data View Toggle: Provides access to a more comprehensive dataset.
-
-
Visualization Options:
-
Freeform Table: Automatically generated tabular view based on selected components.
-
Bar Chart: Visual representation of the same data for quick pattern recognition.
-
💡 This tool helps users explore custom action performance across audiences, timeframes, and operational dimensions—supporting data-driven optimization of journey execution.
Custom Action Monitoring in AJO provides the visibility needed to ensure reliable, scalable, and performant customer journeys. By understanding the metrics and their calculations, teams can proactively troubleshoot issues, optimize throughput, and deliver seamless experiences.
For advanced use cases, consider integrating alerts, anomaly detection, and automated remediation workflows using Adobe’s extensibility features.