Unlocking the Power of Data with 'View SQL' in Dashboards
In today's data-driven world, the ability to quickly access, understand, and manipulate data is invaluable. One of the most interesting features of Adobe Experience Platform is the View SQL capability, a feature designed to offer transparency and flexibility in how data informs customer Profiles, Audiences, and Destinations.
Why Is this Critical?
- Empowering Data Transparency: The View SQL feature acts as a bridge for marketing professionals to directly access and understand the SQL-driven customer insights, catering to all technical levels.
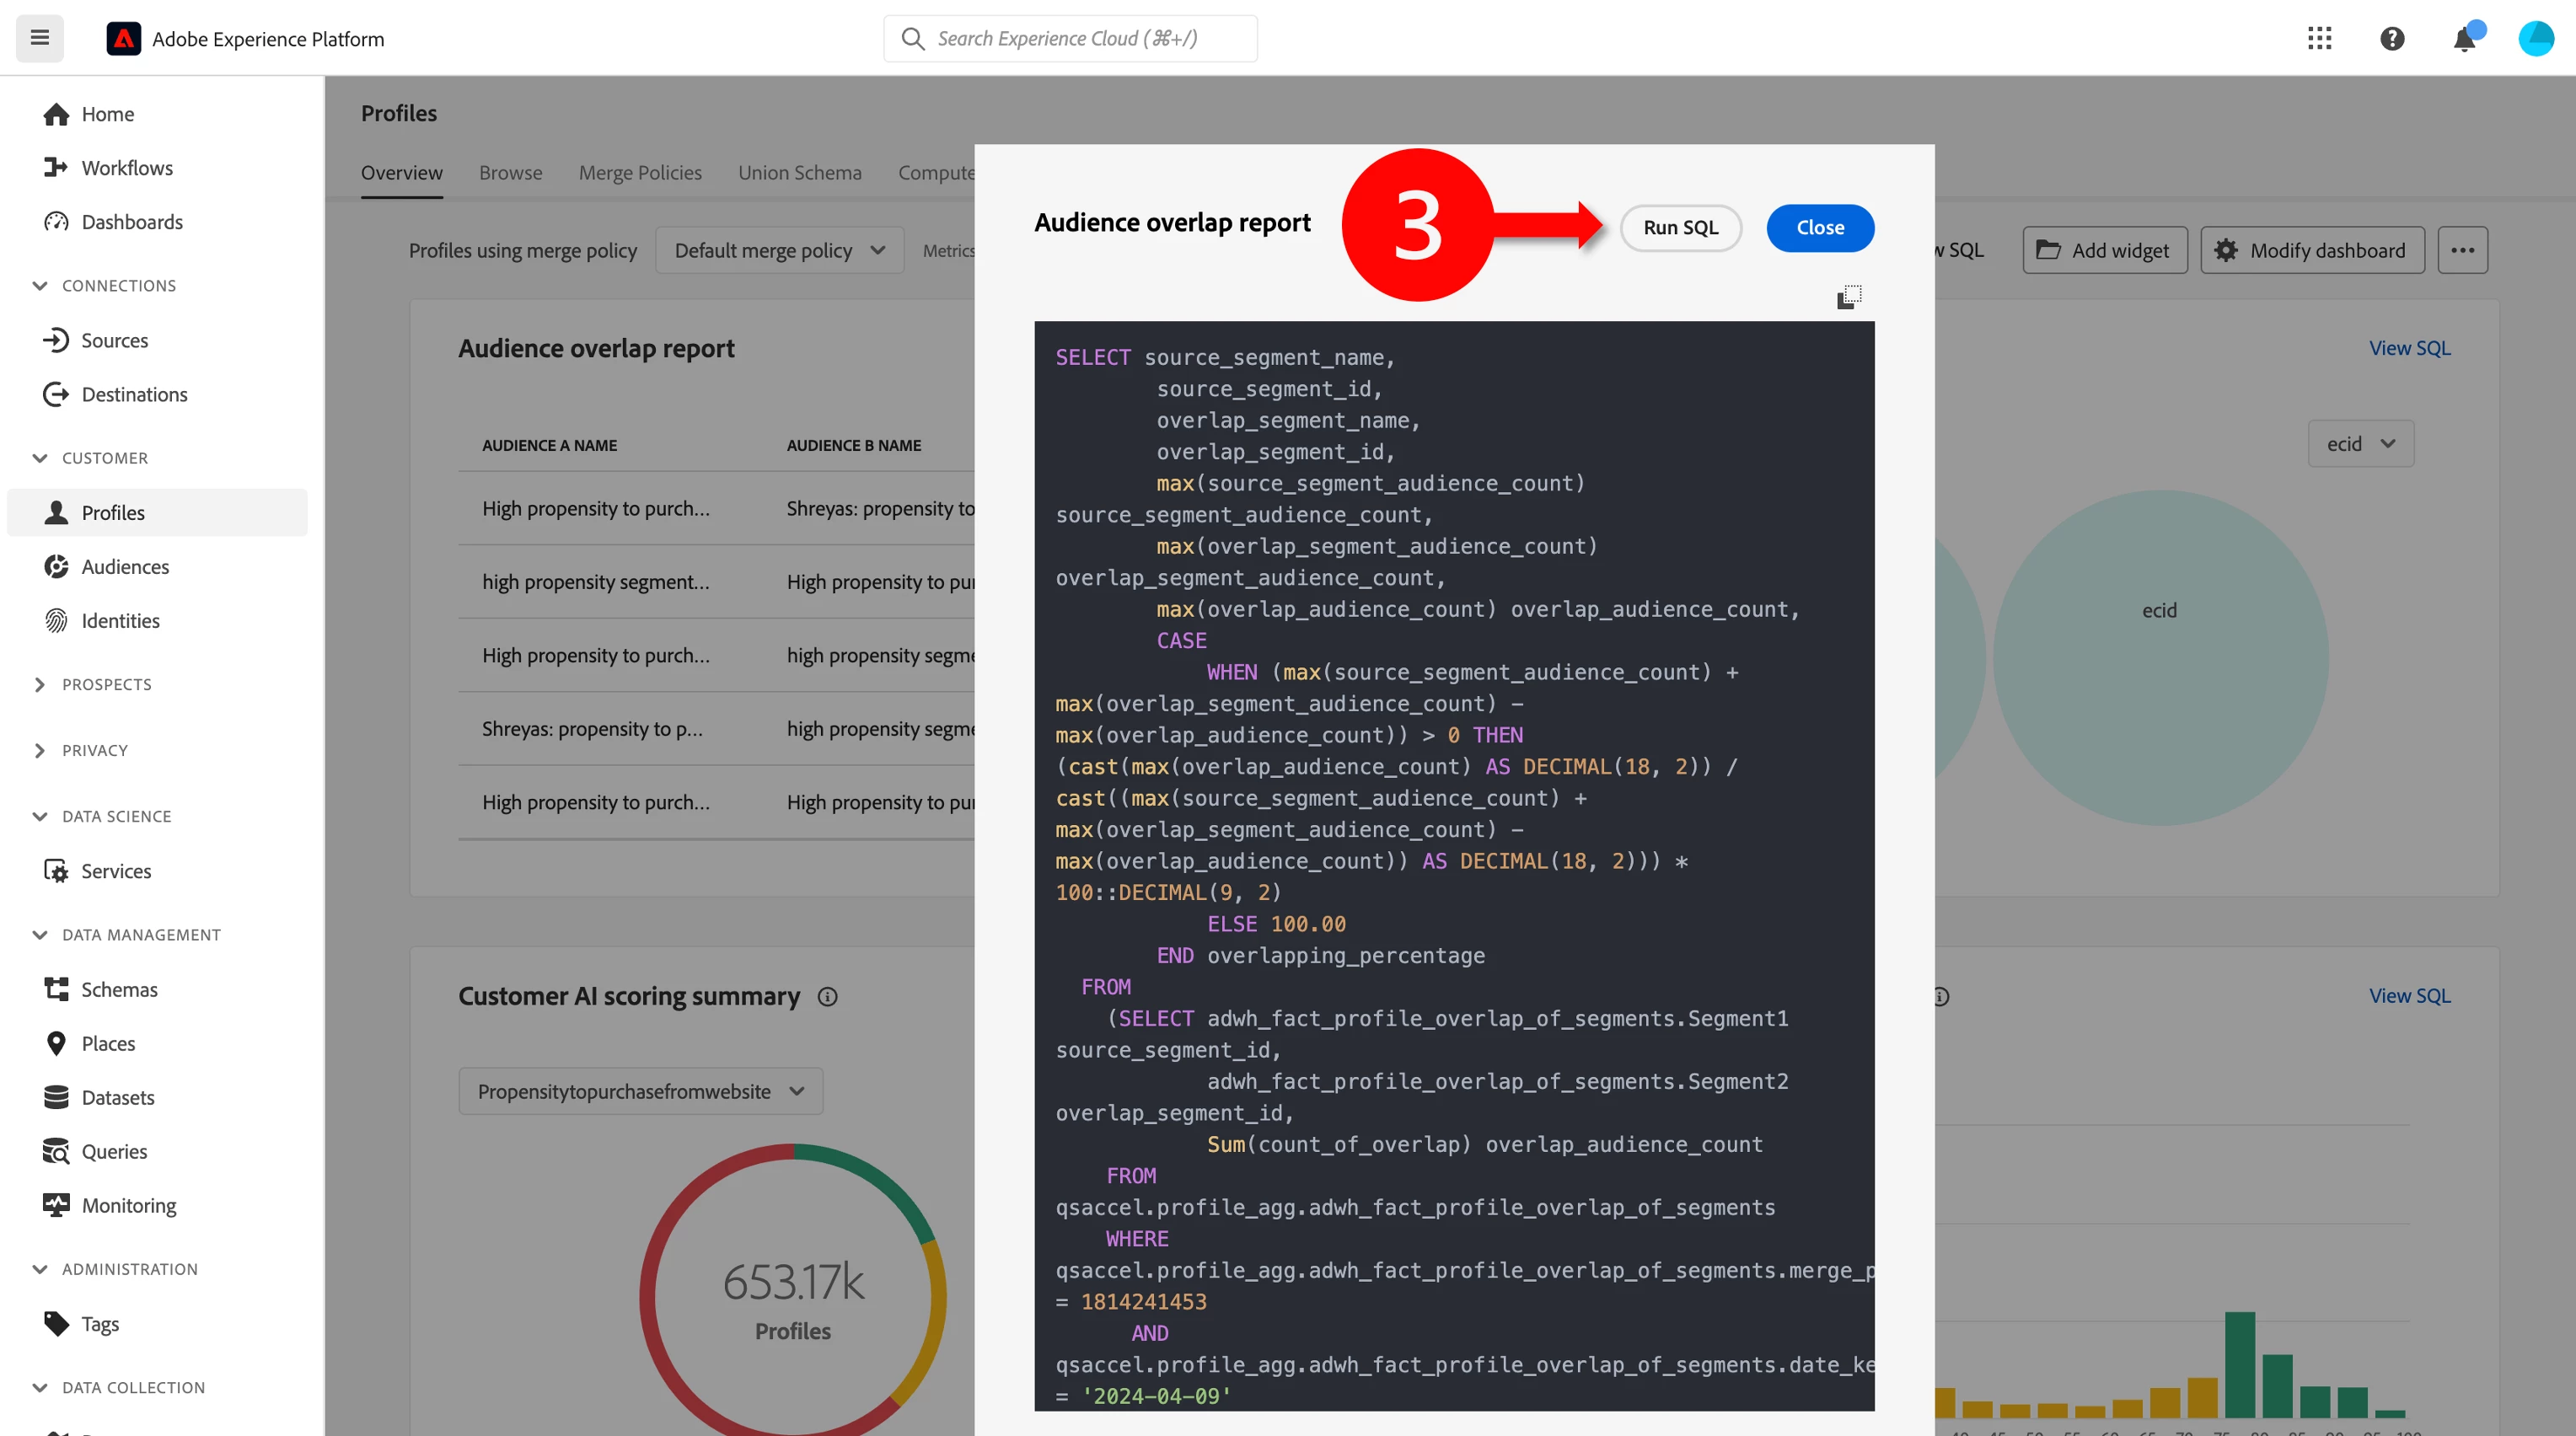
- Inspiring Data Exploration: Beyond transparency, View SQL serves as a launching pad for personalized data exploration. Users are not only able to see the exact SQL driving their dashboard charts but also have the freedom to run these queries with the click of a button. This immediate feedback loop empowers users to experiment and learn from the data in real-time.
- Facilitating Customized Insights: Perhaps the most exciting aspect of View SQL is the opportunity it presents for customization. Users inspired by the base SQL can tweak and refine the queries to fit their unique business questions. This means that the insights gleaned can be as nuanced and specific as the questions you bring to it, offering tailored answers that go beyond generic reports.
Example of View SQL in Action
The View SQL feature on the Profiles, Audiences, and Destinations overview pages provides users with the ability to validate data and draw inspiration from the SQL. Users can also modify the SQL before executing it in the Query Editor. Let's consider why this functionality is crucial through an example.
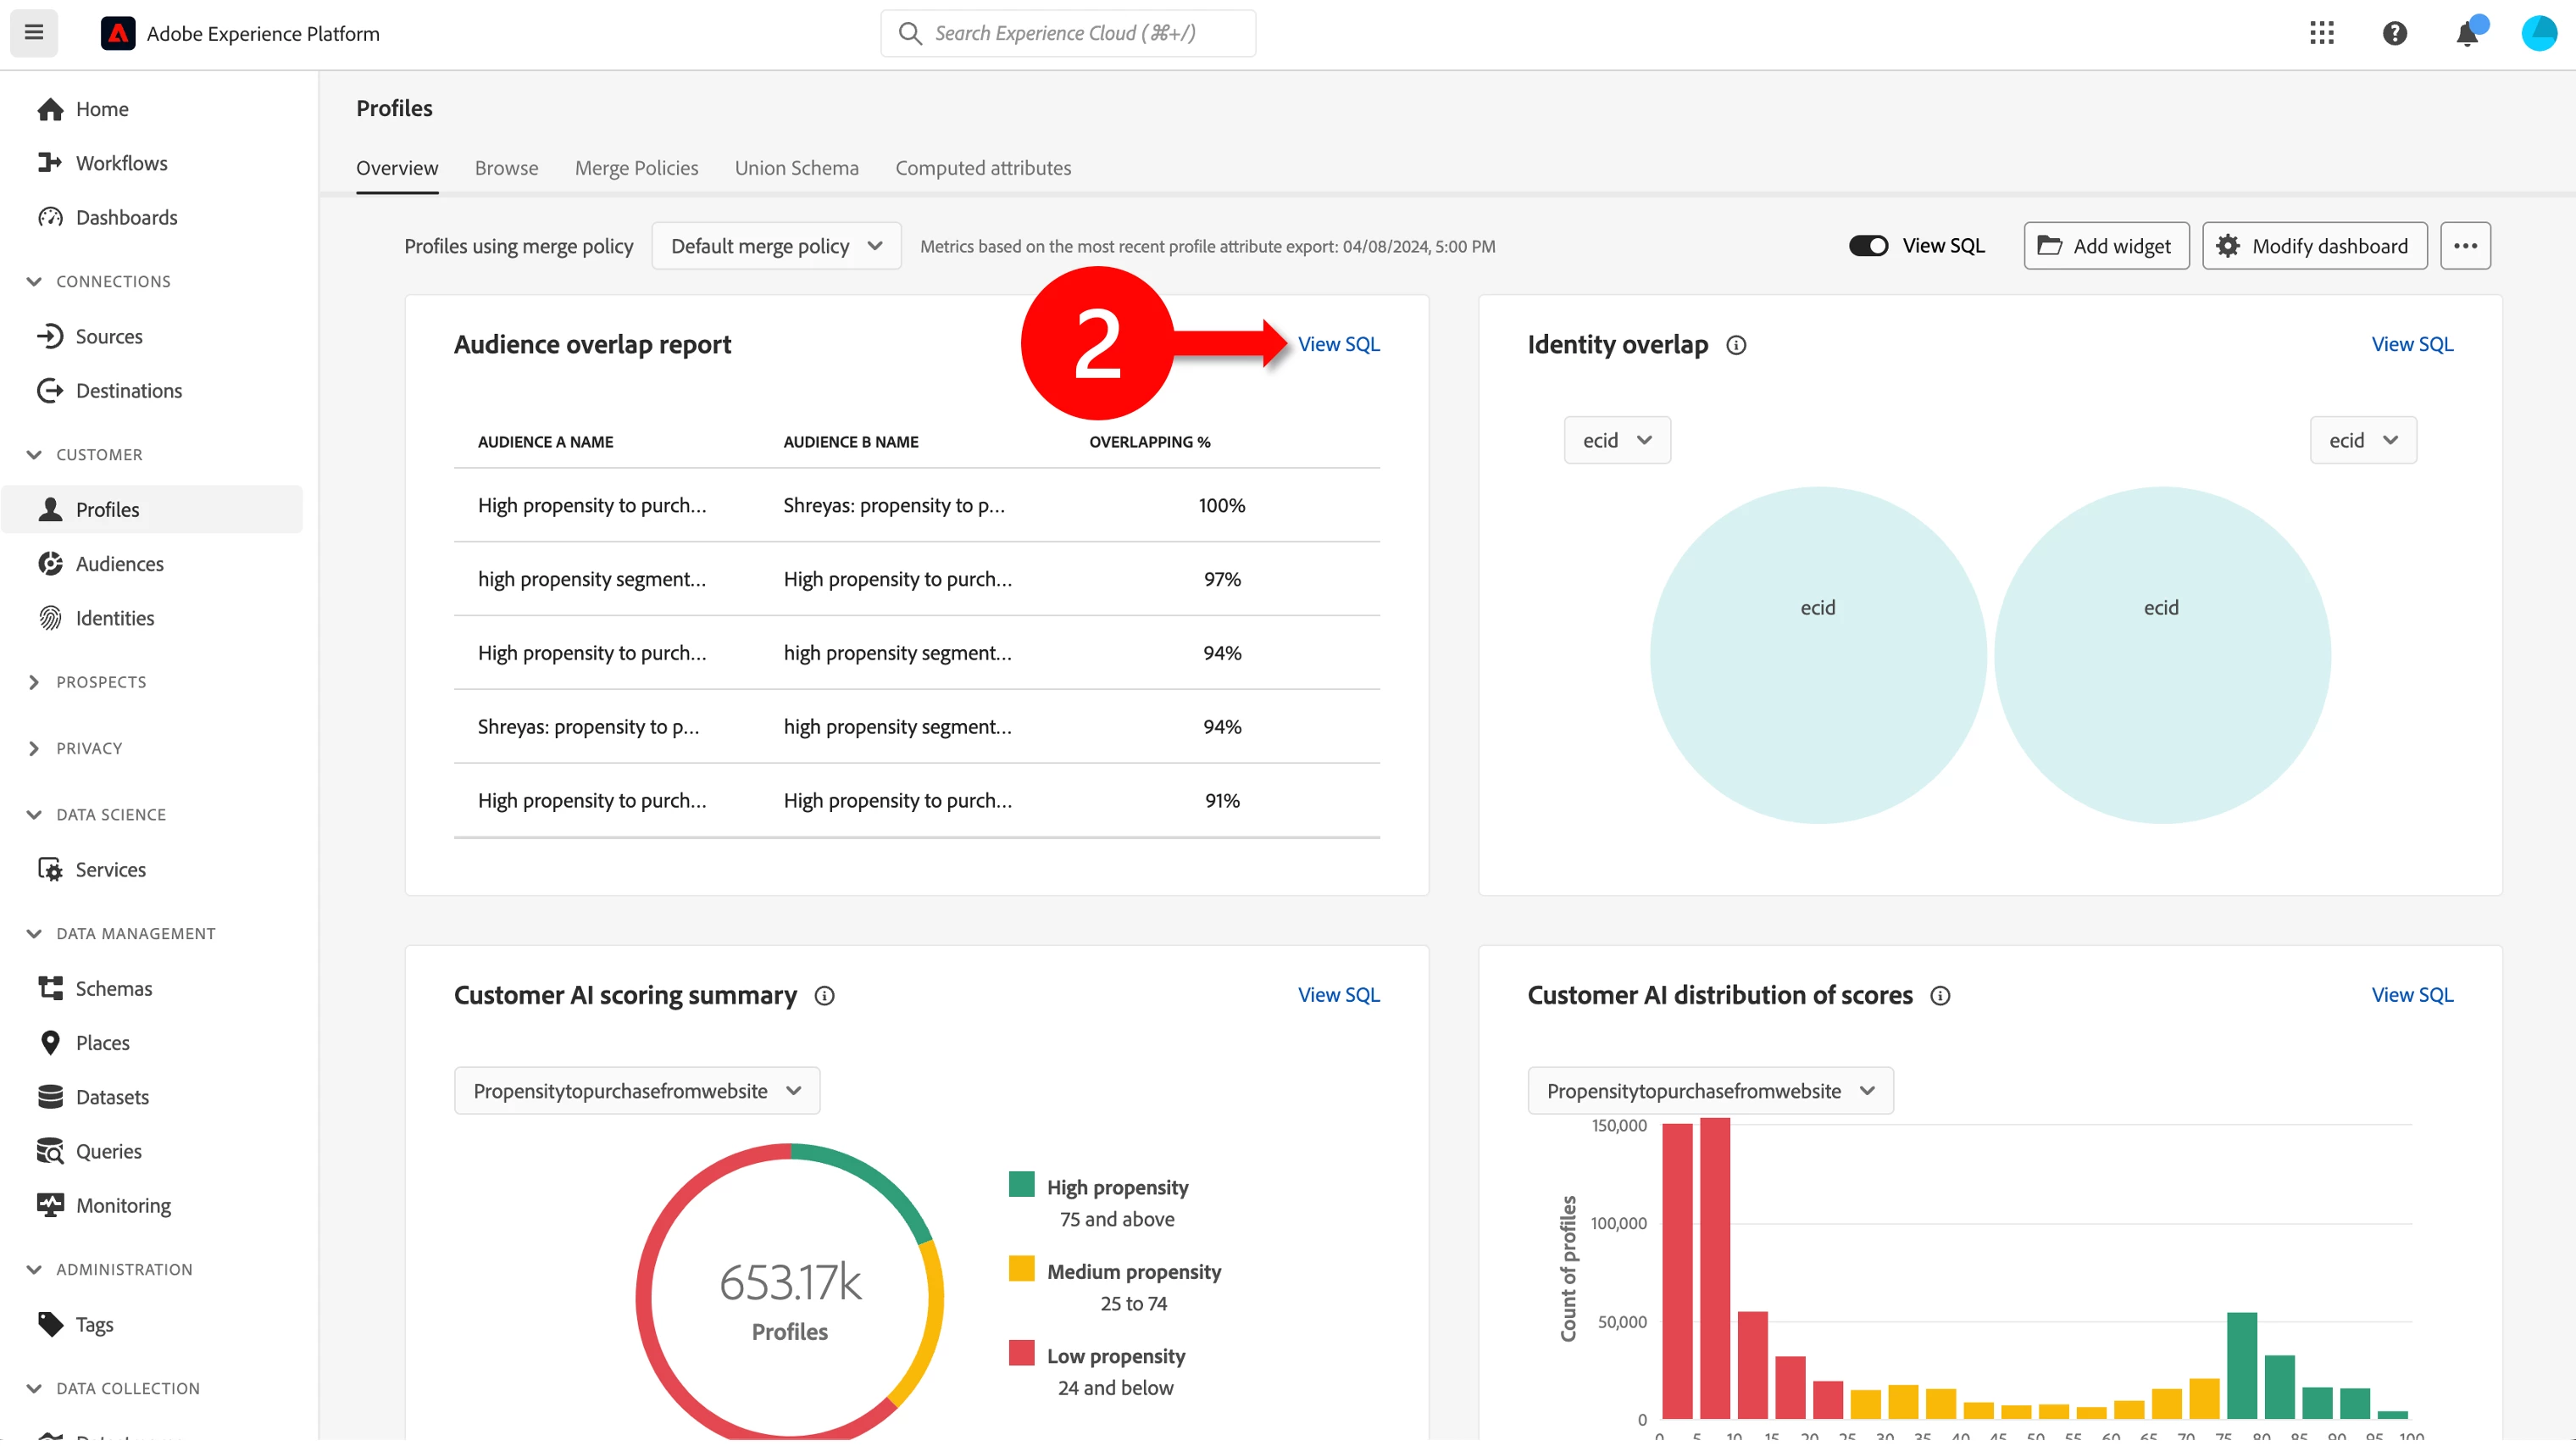
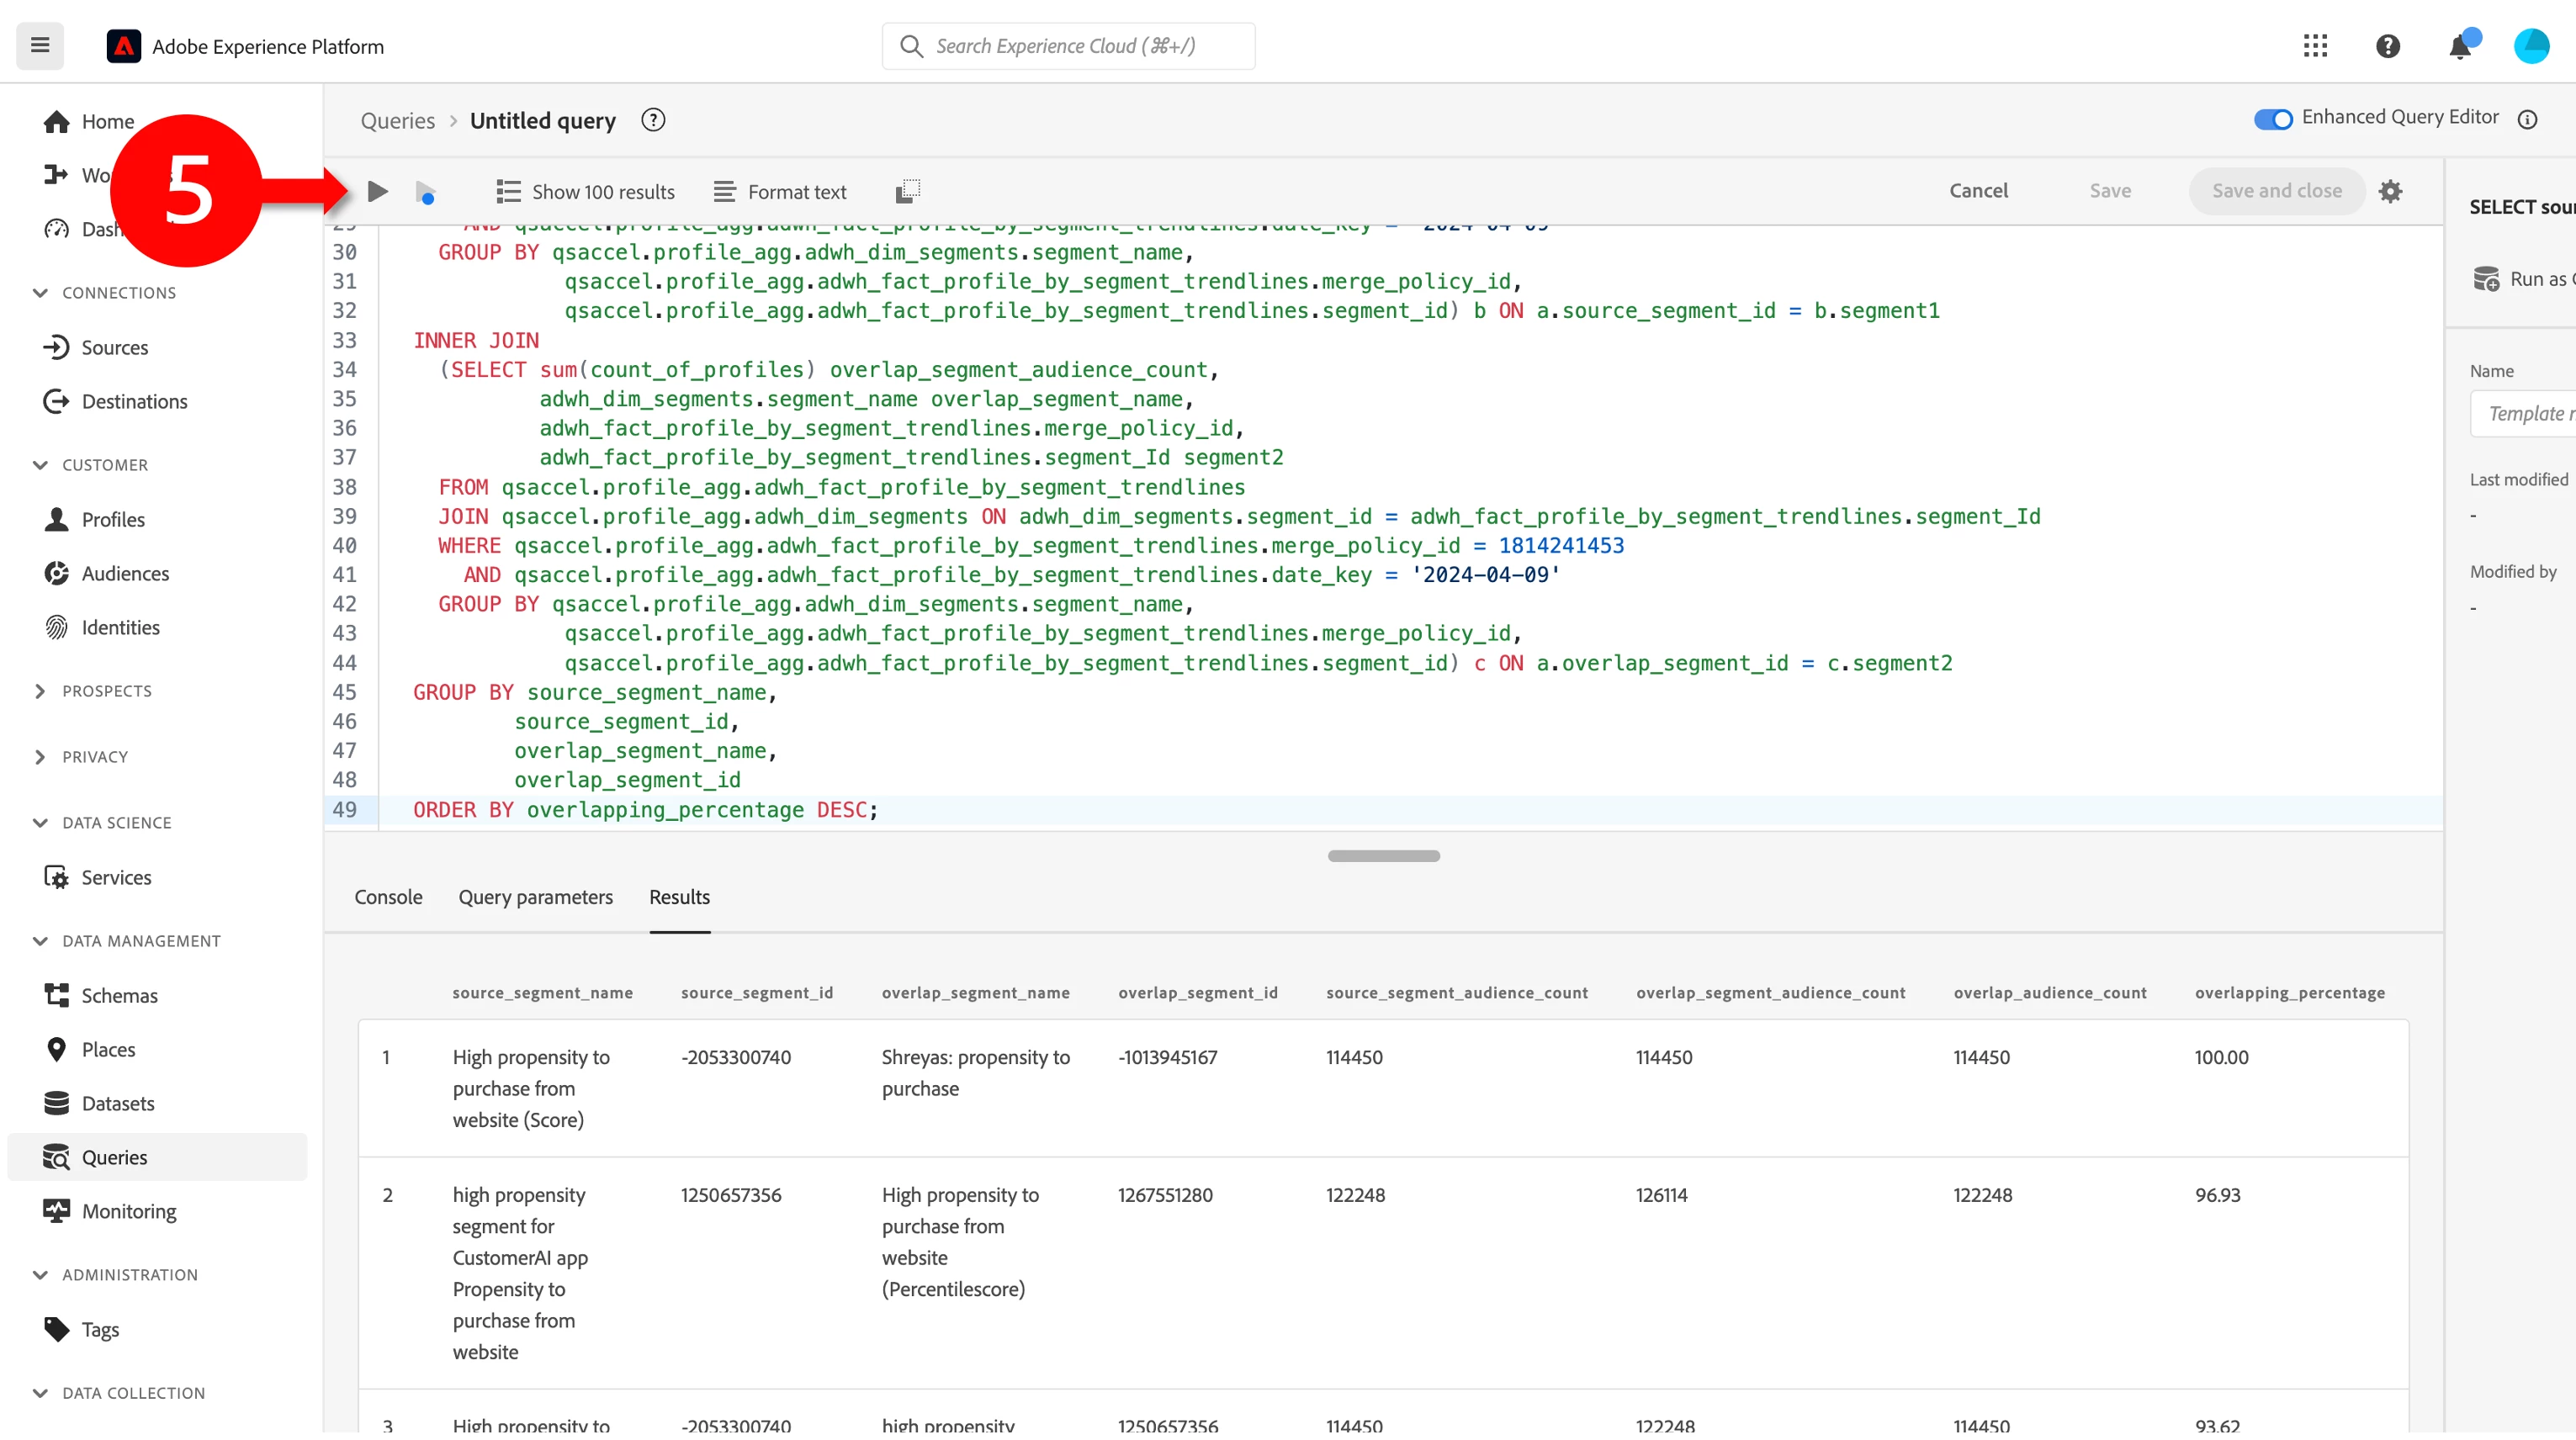
Among our most sought-after insights is the Audience Overlap Report. By default, this report displays the top five overlapping audiences. However, what if you need the complete list? With the View SQL feature, you can now review and edit the SQL, changing the "Limit 5" parameter to retrieve as many records as desired, as demonstrated below.
Steps:
1. Enable View SQL
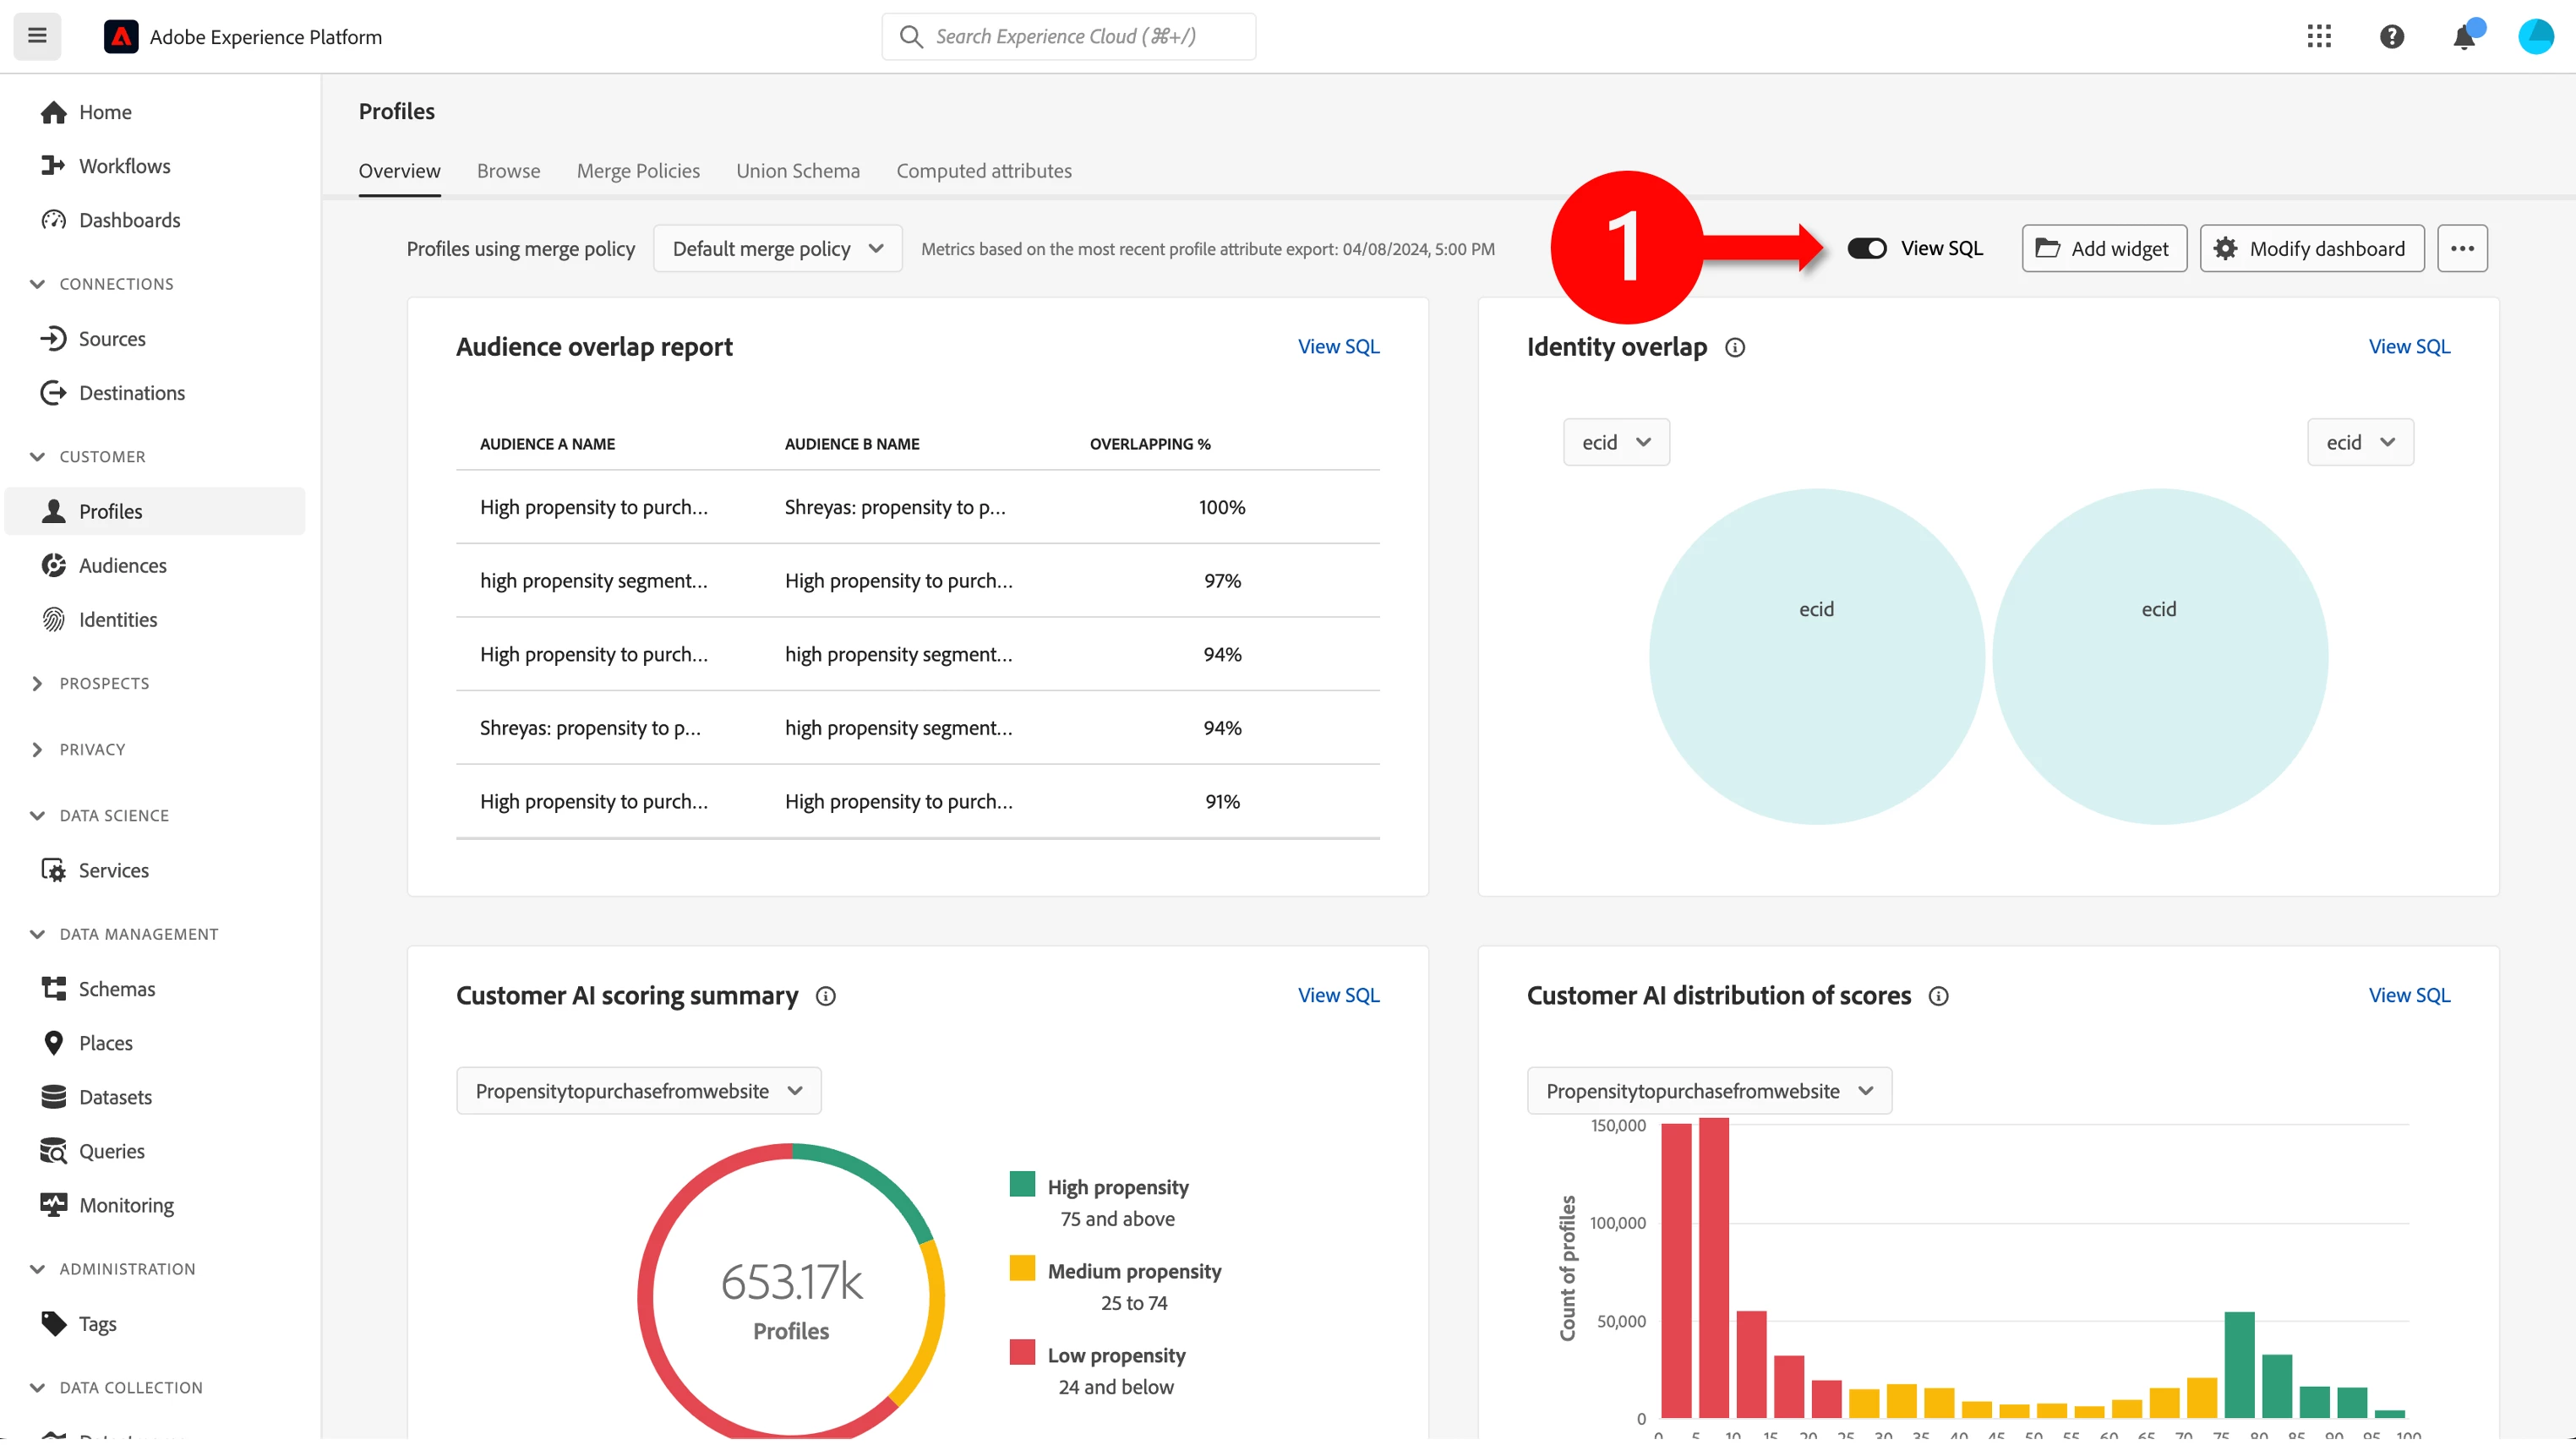
2. Click View SQL on the desired chart.
3. Click Run SQL
4. Make changes
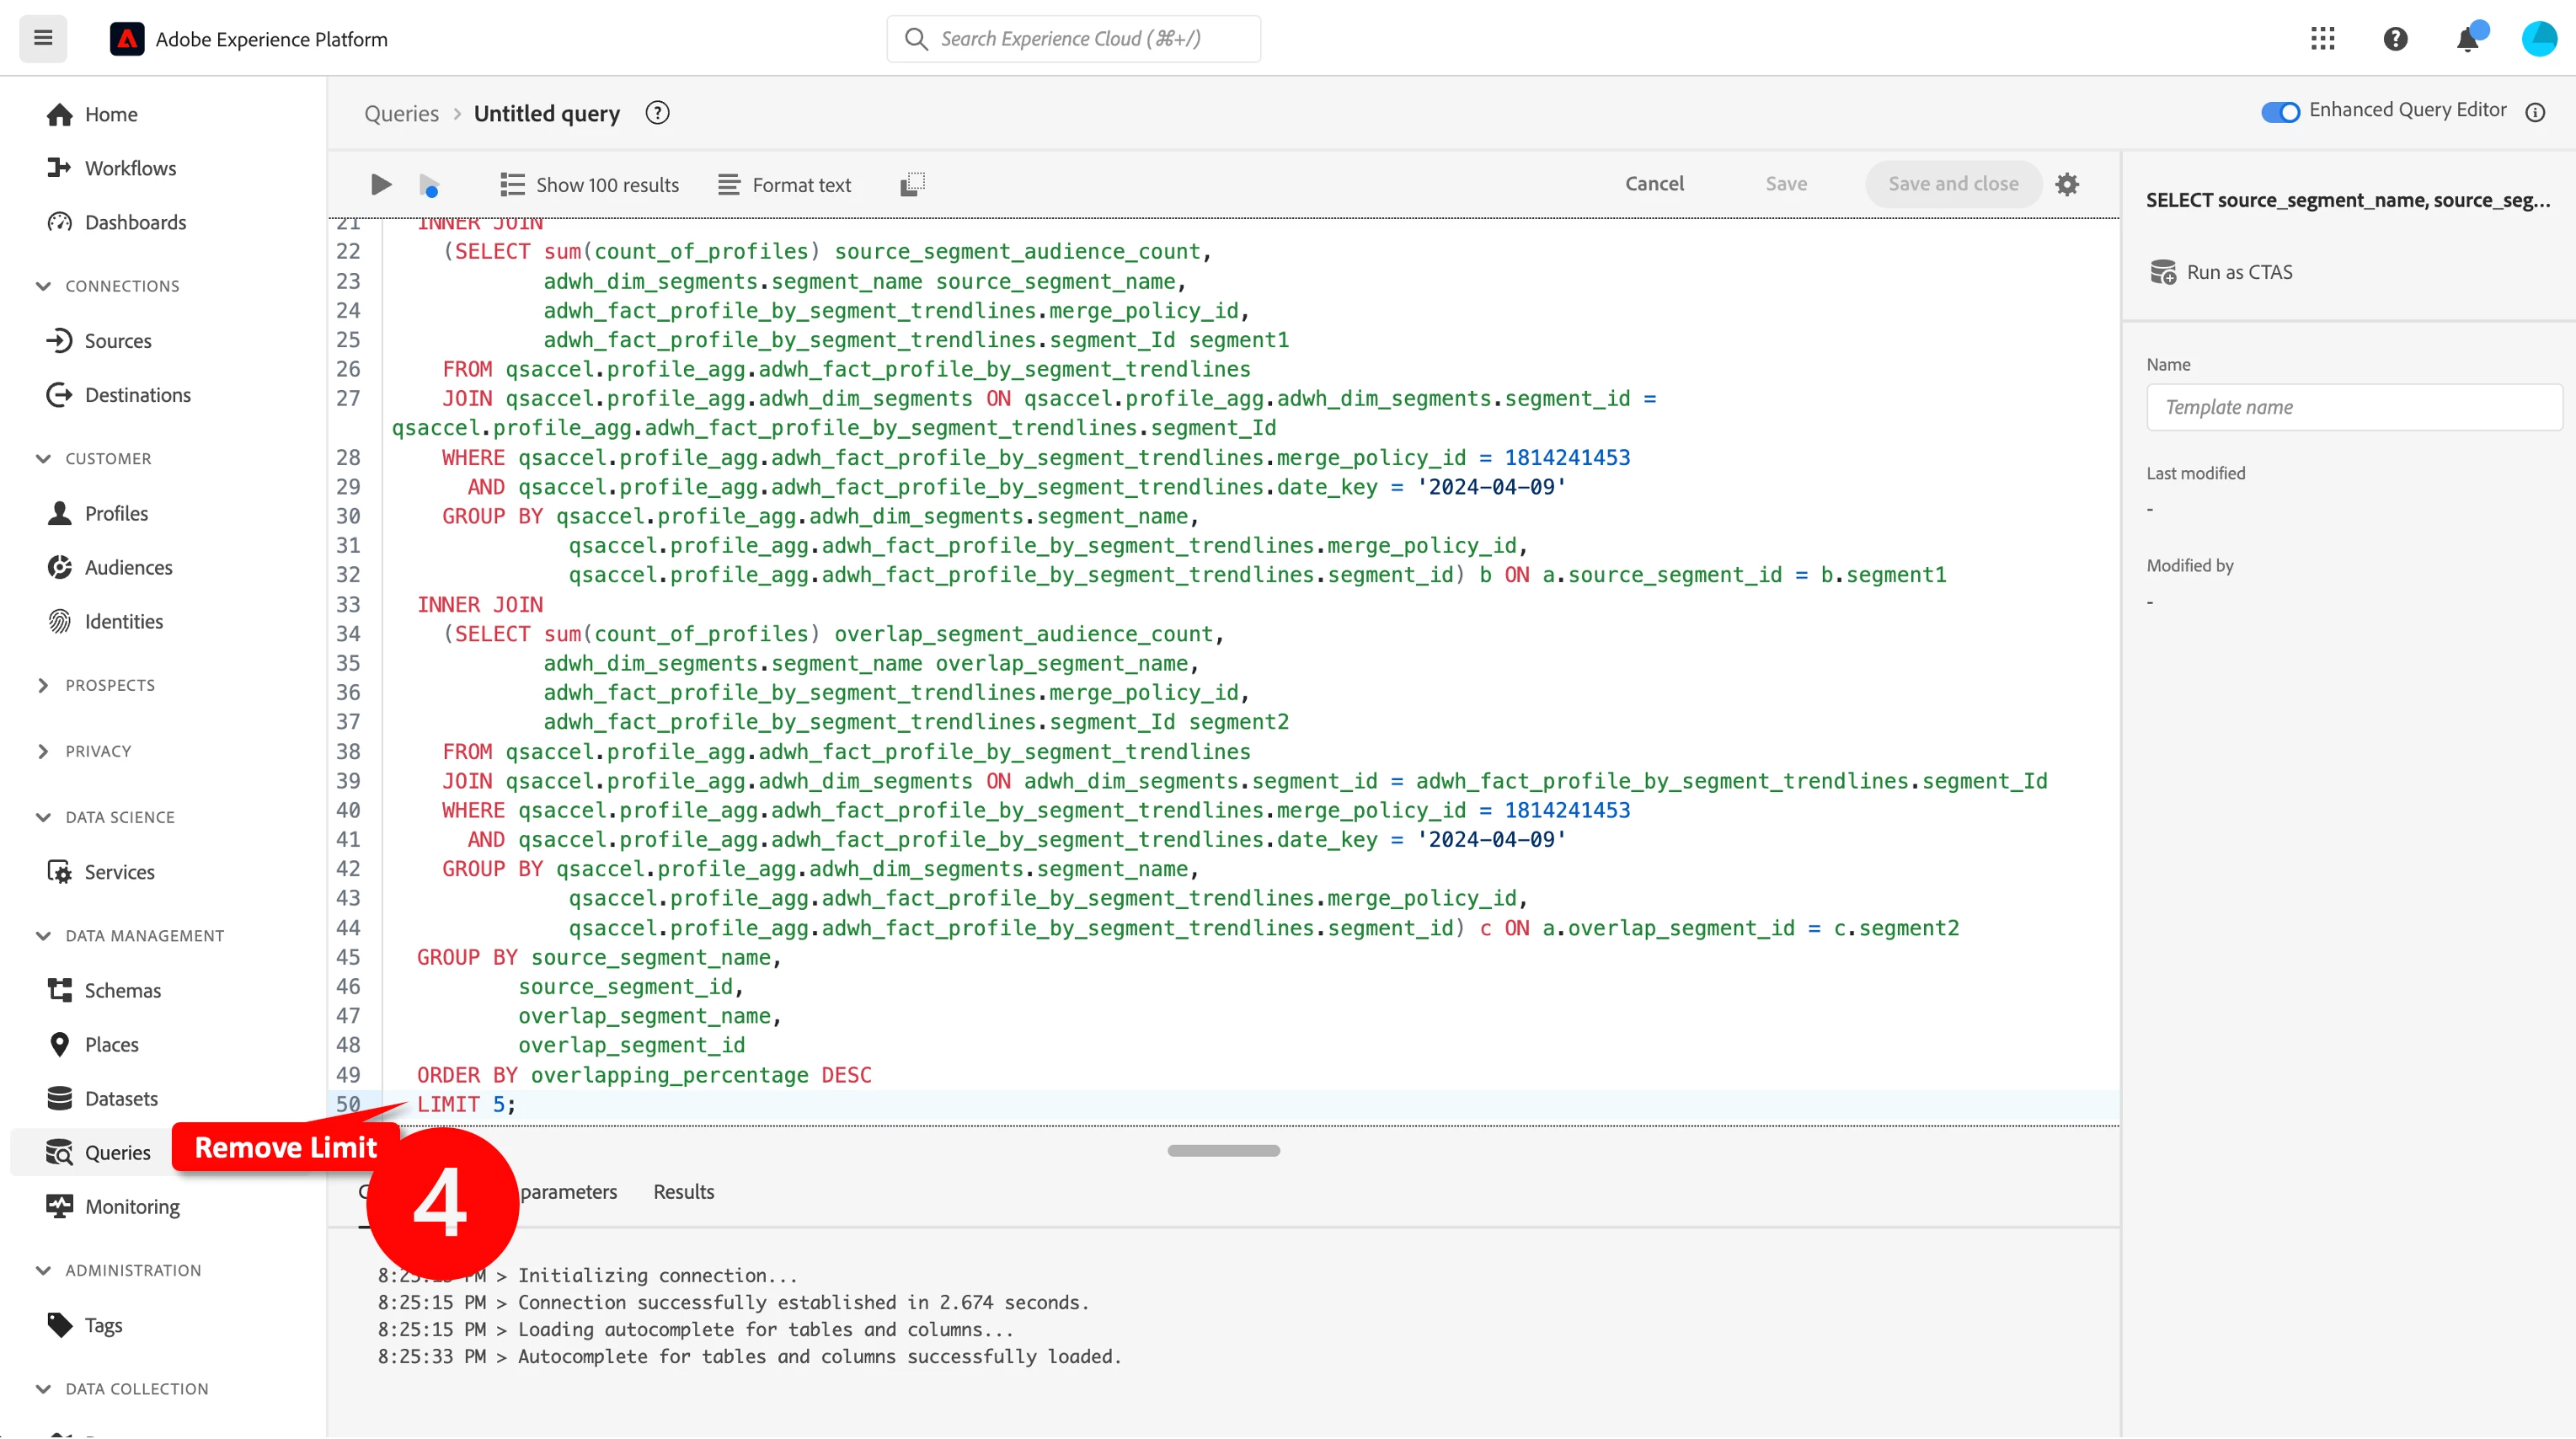
5. Run the SQL to get the desired results
This is merely one example among many. Profiles, Audiences, and Destinations offer more than 50 insights right out of the box. With this feature, you can easily extend your capabilities using the power of SQL.
The advantages continue, as the View SQL feature is also accessible in Dashboard. Therefore, if you've created your own widget based on either the CDPInsights data model or your custom insights data model through Data Distiller, you have the ability to review the SQL generated by Dashboard for enhanced control.
A Step Towards Data-Driven Decision Making
In the end, the View SQL feature is more than a technical tool; it's a commitment to making data understandable and actionable for all users. Whether you're a data analyst looking to dive deeper into the metrics or a marketing professional seeking to understand the "why" behind your campaign performances, View SQL brings the power of data directly to your fingertips.
Author: @annamalai

