Expand my Community achievements bar.

Value of Combo Chart in Analysis Workspace

Avatar

Employee

7/18/23

Value of Combo Chart

The combination chart is a visualization that combines the features of the bar chart and the line chart. Combo charts are valuable for: 

  • Comparing multiple metrics with different value ranges.
  • Illustrating the correlation between two metrics in one visualization.
  • Checking whether one metric meets the target defined by another measure

Combination charts visually highlight differences between data sets and make it easy to see one collection of information presented in relationship with other data. The combination chart displays the data using bars and lines, each representing a particular category. For instance, the bar may represent “Units,” whereas the line means “Orders.” This chart shows the correlation between units and sales volumes.

Combo Chart for Two or More Metrics

  1. Drag and drop Combo Chart visualization into the Freeform table.
  2. Select a dimension— day, week, or month dimensions are a good starting point.
  3. Select your first metrics. In this case, we will select “Cart Additions.”
  4. Under the “Line Comparison” drop-down, select “Secondary Metric.” We will choose “Orders” as our secondary metric.

jenmarti_0-1689690911707.png

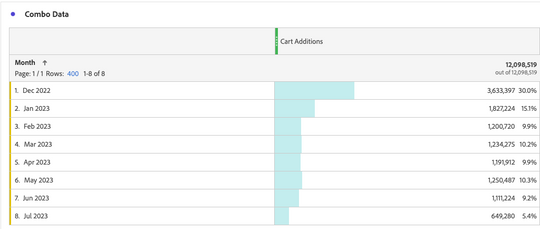
      5. Click on the “Gear” icon and navigate to > Settings > General > Percentages. Select the “Percentages” box to switch the chart to percentages instead of the actual values. The graph will now show the portion of the whole for each month. For instance, based on the screenshot below, we see that 30% of Cart Additions made over the last eight months happened in December 2022: 

jenmarti_1-1689690957288.png

     6. We can arrive at the 30% shown above by taking the number of Cart Additions in December 2022 and dividing it by the total number of Cart Additions over the last eight months, which is 12,098,519, as shown in the Freeform table below:

jenmarti_2-1689690988277.png

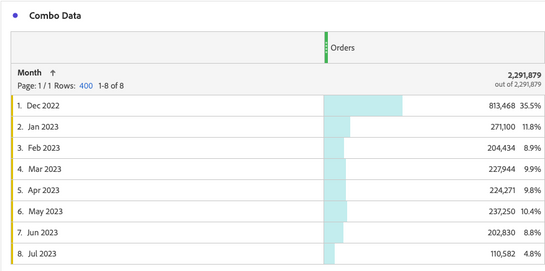
     7. We can arrive at the Cart Additions rate for the following months by performing the same calculation using the values from January- June 2023. We will calculate the Orders rate the same way, but using the correct numbers, as shown below:

jenmarti_3-1689691019836.png

     8. As a result, we can take the Cart Additions and Orders percentage from each month to more easily compare how both metrics are trending over time to understand how Cart Additions translate into Orders.

Combo Chart for Two Different Periods

  1. Drag and drop Combo Chart visualization into the Freeform table.
  2. Select a dimension— day, week, or month dimensions are a good starting point.
  3. Select your first metrics. In this case, we will select “Visits.”
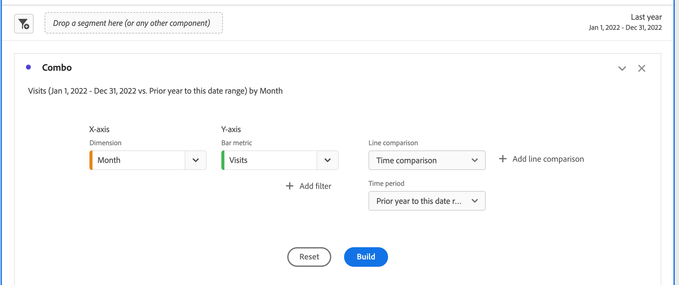
  4. Under the “Line Comparison” drop-down, select “Time Comparison.” This line comparison pulls data based on the date range you use, so be sure to adjust it appropriately. In this case, we will set our panel date range to “Last Year.” As a result, Workspace will automatically give you the option to compare data from the “Last Year” to the “Prior year to this date range.” The option to create a custom date range to the current one is also available. The resulting Combo Chart will appear similar to the below example: 

jenmarti_4-1689691095928.png

jenmarti_5-1689691120714.png

Combo Chart Using Functions

  1. Drag and drop Combo Chart visualization into the Freeform table.
  2. Select a dimension— day, week, or month dimensions are a good starting point.
  3. Select your first metrics. In this case, we will select “Revenue.”
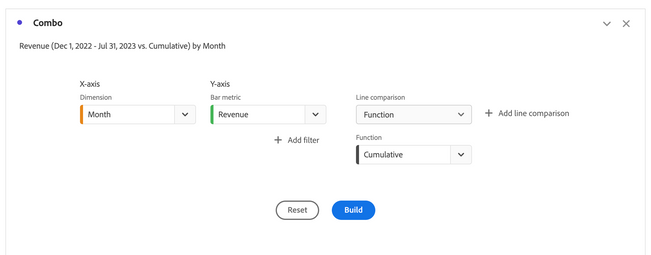
  4. Under the “Line Comparison” drop-down, select “Function.” Here, you can choose from functions such as Mean, Cumulative, Cumulative Average, Median, etc. In this example, we will create a chart using the Cumulative function, which will display monthly sales & cumulative sales, as shown below:

jenmarti_6-1689691205554.png

jenmarti_7-1689691225127.png


2 Comments

Avatar

Level 1

8/3/23

How do i Combine side by side bar charts of YoY for 2 years by months with cumulative lines?

Avatar

Level 10

9/6/23

Using the combo chart with functions is an interesting use case. For a traffic goal chart, I tried months, unique visitors, and function cumulative. Then I thought of using a static number to set a "goal". However, static number is not an available function.