
Mastering Step Events in Adobe Journey Optimizer: Fundamentals, Schema, and Essential Queries for Data-Driven Campaigns
Why Step Events Matter: The Foundation of Journey Analytics in Adobe Journey Optimizer
This is Part 1 of a 3-part series on Step Events in Adobe Journey Optimizer. Jump to: Mastering Step Events in Adobe Journey Optimizer: Fundamentals, Schema, and Essential Queries for Data-Driven Campaigns | Troubleshooting Step Events in Adobe Journey Optimizer: Diagnosing Errors, Discards, and Failures for Reliable Customer Journeys | Optimizing and Validating Adobe Journey Optimizer Step Events: Performance Analytics, Feedback Integration, and Guardrail Monitoring
What to expect from this trilogy: This 3-part blog series is your comprehensive guide to mastering Step Events in Adobe Journey Optimizer.
Part 1 lays the foundation—explaining the Step Events schema, key identifiers, and essential queries for understanding journey analytics.
Part 2 dives into troubleshooting, showing you how to diagnose errors, discards, and failures to ensure reliable customer journeys.
Part 3 focuses on performance optimization, validation, and integrating feedback, equipping you to monitor, tune, and cross-validate your journeys for maximum impact.
i) Getting Access
- Make sure you have Query Service access to the target sandbox.
- Preferred tools: AEP Query UI or any Postgres-compatible client (e.g., DB Visualizer) using the same credentials.
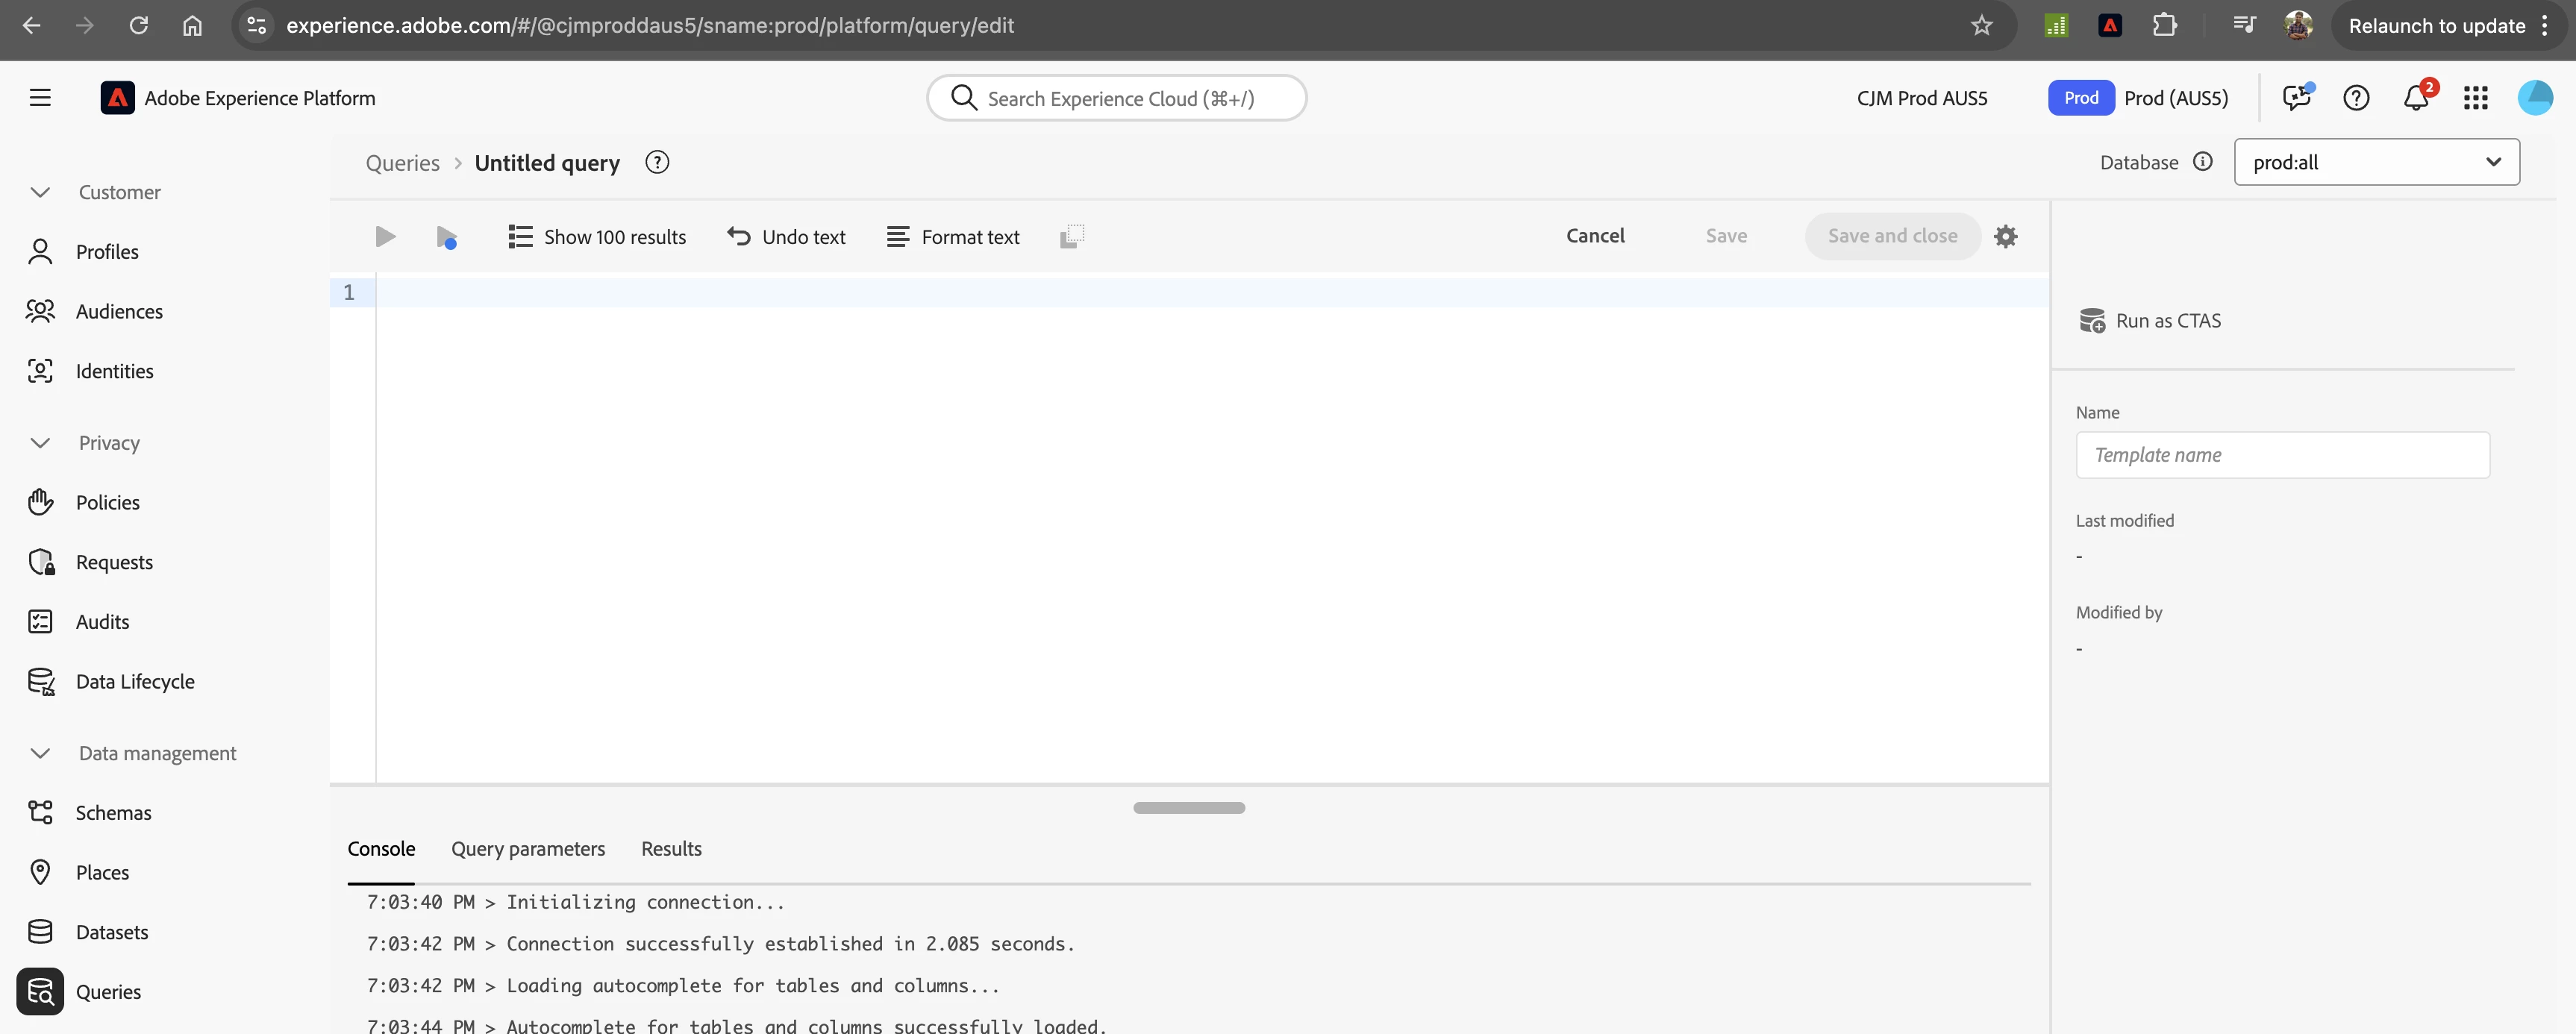
Here's what the Query Service UI looks like in Adobe Experience Platform:
ii) Schema Overview
Key nested sections of _experience.journeyOrchestration :
Section What it captures
| stepEvents | Orchestration info at per node, per profile level (nodeType, nodeName, stepStatus, …) |
| serviceEvents | Up-stream or infra signals (dispatcher discards, orchestrator export jobs…) |
| profile & journey | Present only on certain error paths today; future-proofed for all events |
The attributes above reside in the flattened analytics dataset named journey_step_events. Below are the leaf fields you will query most often:
- journeyVersionID – UUID of the journey version you are analyzing.
- nodeType – start, action, condition, wait, etc.
- stepStatus – SUCCEEDED, FAILED, TIMED_OUT, and more.
- entrance – Boolean flag set only on the first node hit when a profile enters.
- instanceEnded – Boolean flag set when a profile finishes (whatever the outcome).
- timestamp – Node execution time in ISO-8601 (UTC).
{
  "_experience": {
    "journeyOrchestration": {
      "stepEvents": [
        {
          "journeyVersionID": "9ac7ac5e-1234-4cde-8a2b-61b6faeab999",
          "nodeType": "action",
          "nodeName": "Send Email #1",
          "stepStatus": "SUCCEEDED",
          "timestamp": "2024-02-14T16:32:11Z"
        }
      ]
    }
  }
}
Journey Identifiers & Time Filters
Know your journey IDs – The journeyVersionID is the UUID you see as the last segment of the URL when a journey version is open. Its friend journeyVersionName is the human-readable display name. You will reference one of these in almost every query.
-- ISO timestamp stored as TIMESTAMP type. Keep it raw for Common Table Expressions.
SELECT timestamp
FROM   journey_step_events
LIMIT  10;

-- Last 48 hours
WHERE timestamp > (NOW() - INTERVAL '48 hour');

-- Group by calendar day
SELECT DATE(timestamp) AS event_day, COUNT(*)
FROM   journey_step_events
GROUP  BY event_day;
iii) Your First Queries
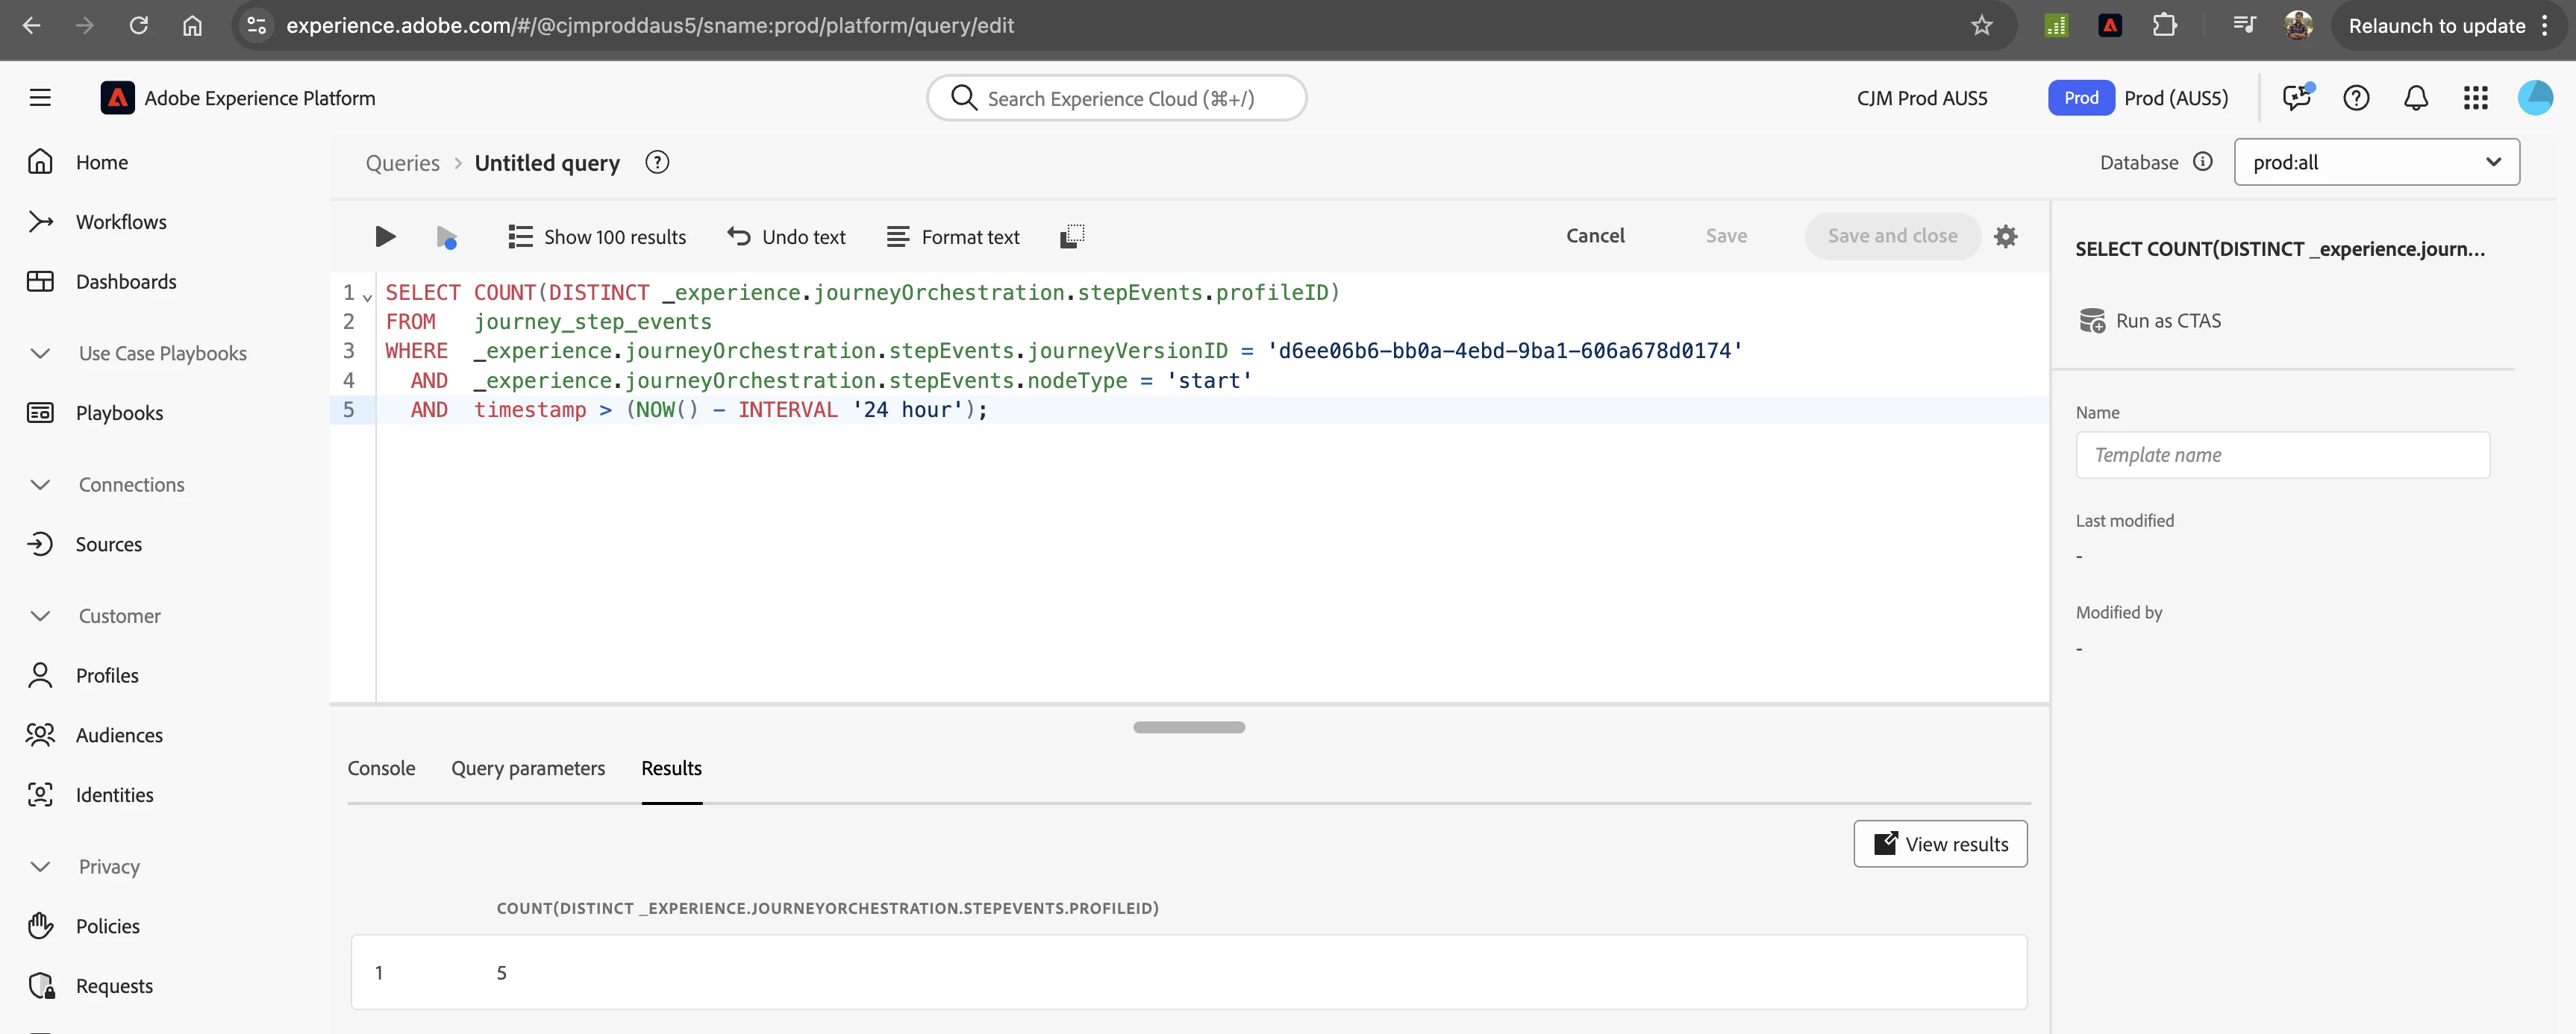
1. How many unique profiles entered a journey in the past 24 h?
Let's start with a foundational query: getting a simple headcount of who's knocking on the journey's front door.
SELECT COUNT(DISTINCT _experience.journeyOrchestration.stepEvents.profileID)
FROM   journey_step_events
WHERE  _experience.journeyOrchestration.stepEvents.journeyVersionID = '<journeyVersionID>'
  AND  _experience.journeyOrchestration.stepEvents.nodeType = 'start'
  AND  timestamp > (NOW() - INTERVAL '24 hour');
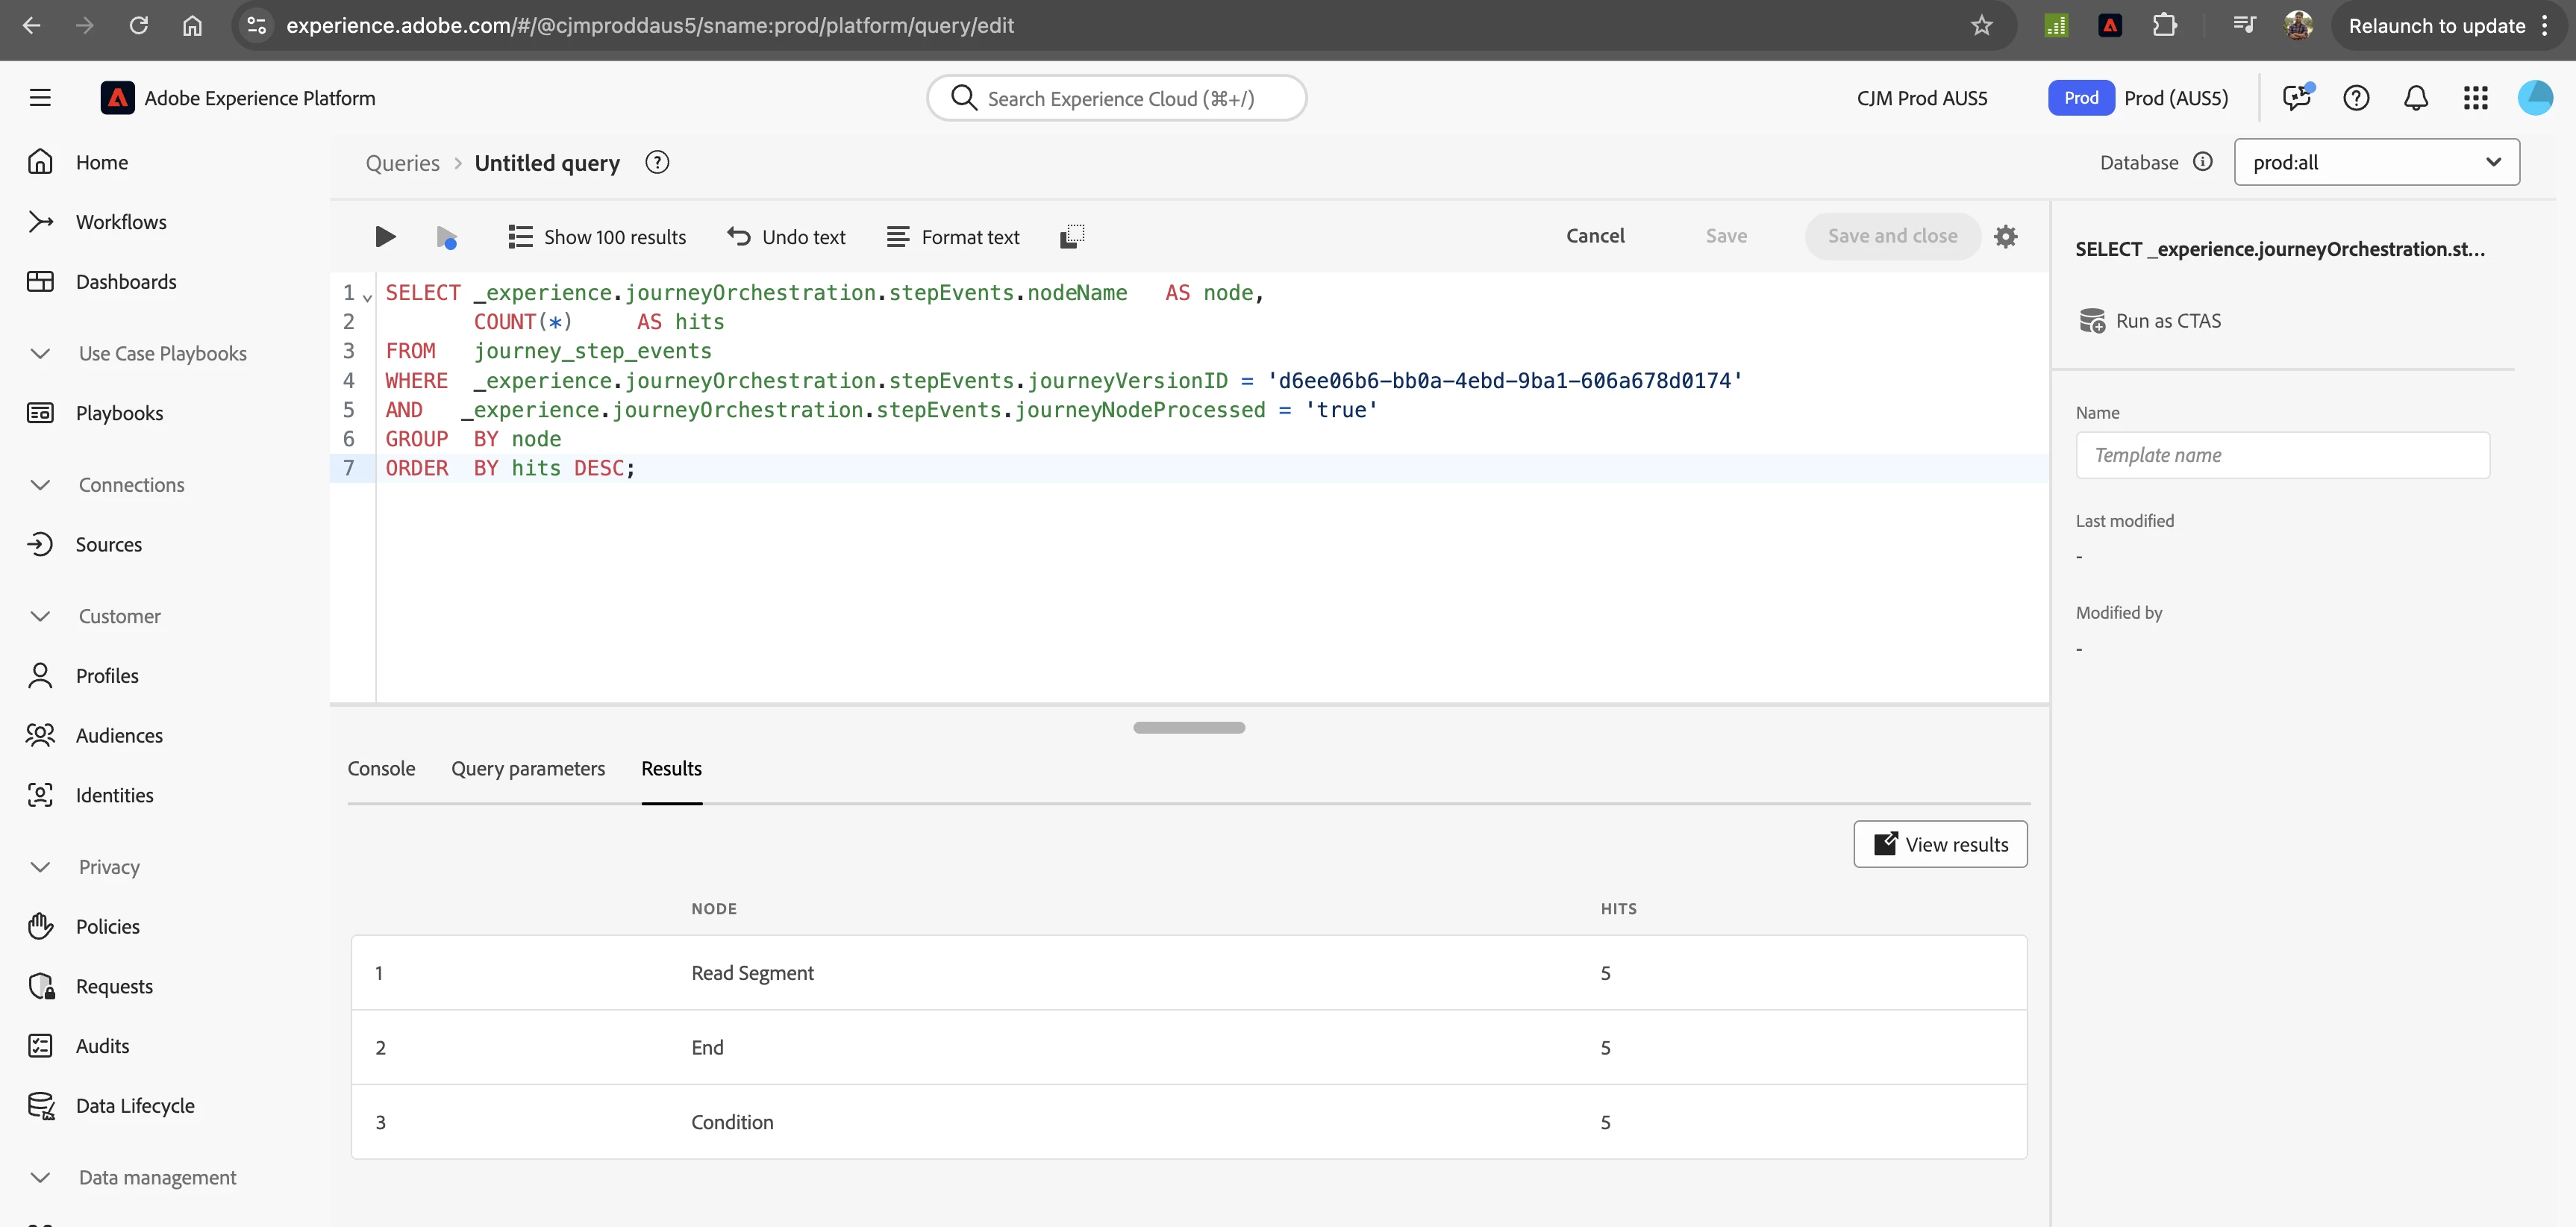
2. Node heat-map (entries per node name)
Time to find the hot-spots. This query acts like a thermal camera, revealing which nodes on your canvas are getting the most traffic.
SELECT _experience.journeyOrchestration.stepEvents.nodeName   AS node,
       COUNT(*)                                             AS hits
FROM   journey_step_events
WHERE  _experience.journeyOrchestration.stepEvents.journeyVersionID = '<journeyVersionID>'
AND   _experience.journeyOrchestration.stepEvents.journeyNodeProcessed = 'true'
GROUP  BY node
ORDER  BY hits DESC;
iv) Counting Entrances
Your CMO asks, "How many real humans actually entered that flashy welcome journey yesterday?" You have 10 minutes before the exec meeting. Time to wield SQL like a lightsaber.
Before diving in, keep Adobe's canonical Examples of queries page open in another tab. We'll upgrade those snippets with re-entrance logic and throughput heat-maps.
1. Tracking Exits
Just as important as who comes in, is who leaves. Let's see the total number of profiles that have finished the journey.
-- Total exits (any status) last 24 h
SELECT COUNT(*)
FROM   journey_step_events
WHERE  _experience.journeyOrchestration.stepEvents.journeyVersionID = '<journeyVersionID>'
  AND  _experience.journeyOrchestration.stepEvents.instanceEnded = TRUE
  AND  _experience.journeyOrchestration.stepEvents.instanceType = 'unitary'
  AND  timestamp > (NOW() - INTERVAL '24 hour');
2. Exit Status Breakdown
Not all exits are created equal. This query breaks down how profiles left—whether they finished, timed-out, or hit an error.
SELECT _experience.journeyOrchestration.stepEvents.stepStatus AS status,
       COUNT(*)                                              AS cnt
FROM   journey_step_events
WHERE  _experience.journeyOrchestration.stepEvents.journeyVersionID = '<journeyVersionID>'
  AND  _experience.journeyOrchestration.stepEvents.instanceType = 'unitary'
  AND  _experience.journeyOrchestration.stepEvents.instanceEnded = TRUE
GROUP  BY status
ORDER  BY cnt DESC;
3. Throughput per Minute (Hot-Spot Detection)
Let's zoom in on the entry-gate's busiest moments. This helps you visualize pressure on the Start node, minute by minute.
SELECT DATE_FORMAT(
         TO_TIMESTAMP(FLOOR(EXTRACT(EPOCH FROM timestamp)*1000/60000)*60000/1000),
         'yyyy-MM-dd HH:mm')               AS bucket,
       COUNT(*)                            AS requests
FROM   journey_step_events
WHERE  _experience.journeyOrchestration.stepEvents.journeyVersionID = '<journeyVersionID>'
  AND  _experience.journeyOrchestration.stepEvents.nodeType = 'start'
  AND  _experience.journeyOrchestration.stepEvents.instanceType = 'unitary'
GROUP  BY bucket
ORDER  BY bucket;
v) Troubleshooting Checklist
- Confirm the event or segment trigger actually fired (check serviceEvents.dispatcher ).
- Verify re-entrance settings on the Start node.
- Make sure the journey version is Running and not Stopped .
- Use the exit breakdown query to see if profiles time-out or hit capping errors.
Summary & What's Next
Congratulations—you now have a working toolbox for exploring the journey_step_events dataset. We covered how to locate your journey IDs, slice data by time, surface hot-spots, and tally entrances vs. exits in minutes.
In Part 2 we will dive deep into troubleshooting failures & discards, turning those raw Step Events into actionable fixes. Part 3 then rounds out the trilogy with performance tuning and validation techniques.
Continue your journey: Troubleshooting Step Events in Adobe Journey Optimizer: Diagnosing Errors, Discards, and Failures for Reliable Customer Journeys | Optimizing and Validating Adobe Journey Optimizer Step Events: Performance Analytics, Feedback Integration, and Guardrail Monitoring