Hello, Lets assume that on our site developments teams tests its application with browsers that consist at least 80% of traffic on any given time. Now I should only know what they those browsers are, and tell them, right
I can easily list the percentage share of each browser, but how to make a calculated metric that would list the browsers needed to break that 80% threshold. For example on the snip attached the last browser would be Safari 13.0.5
Of course i could always tell team to count them by themselves, or use take csv-file but im looking for more elegant way...
Thanks tr
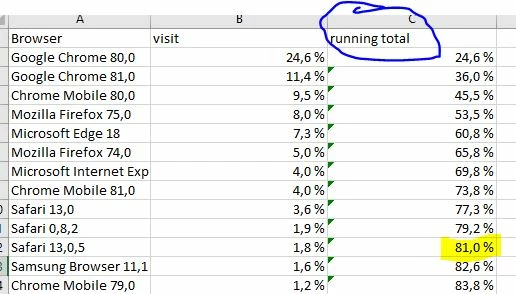
Solved! Go to Solution.
Views
Replies
Total Likes
Create a calculated metric with the cumulative function. While it will not allow you to filter the list automatically, it will definitely help build the table you shared in the screenshot.
---
Help make Adobe Analytics better, vote for the ideas:
Views
Replies
Total Likes
Create a calculated metric with the cumulative function. While it will not allow you to filter the list automatically, it will definitely help build the table you shared in the screenshot.
---
Help make Adobe Analytics better, vote for the ideas:
Views
Replies
Total Likes
Thanks Andrey,
I have used cumulative function using dates before succesfully, but with this case my approach did not work.
I checked your link once again, and it stated, that "Since it's ordered by the dimension it's only useful on dimensions that have a natural order like date or path length." so to my understanding my case cannot be solved, as my dimension is not 'Day', 'Month' but rather 'Browser' which doesnt have a natural order. What i get, see below. On dates it works fine, but Browser cumulative table does not make any sense
BR, tr
Views
Replies
Total Likes
Views
Replies
Total Likes
Views
Likes
Replies
Views
Likes
Replies