
The Significance of Size & Power Calculation in A/B Tests
Author: Nagendra Nukala (@nukala1)
A/B testing is a common mechanism to test out a hypothesis. When A/B tests are run on the web/mobile or other interfaces using solutions like Adobe Target; size, power, statistical significance calculations are taken care in the solution itself. That is a significant advantage of going with a seasoned SaaS solution. Lift and confidence is calculated inline for each alternative in the experiment, Adobe Target lets the user know when is the right time to push the winner to 100%. There is also functionality to smoothen the outcome metric by removing outliers, so that nuance in the power and size calculation is taken care of. There are advanced features like auto-allocate that even push the winner to 100% when the statistical significance is hit. It is recommended to use this feature if you have access to it.

However, A/B tests are not just limited to the web or mobile app, they are run for comparing audience performance in Adobe Audience Manager using the audience lab feature, for emails and push messages in Adobe Campaign, templates in Adobe Experience Manager, page versions on web servers, machine learning algorithm performance comparison, they are every where. So the understanding of size and power calculations as explained above comes in handy. It will help the practitioners guide the business teams pick the right experiment that will give the most benefit. Understanding the math behind, size, power, statistical significance, etc. would make sure right alternative is chosen with a great degree of confidence and more importantly, the wrong alternative is not pushed to production, more commonly referred as type I and type II errors in statistical parlance.
Recently I was reading a book (Analytical Skills for AI and Data Science by Daniel Vaughn) that gave a primer on A/B testing process. There were a few details that stood out, so I thought of putting it down along with resources from Adobe Experience League to help with estimating the size and power for a given A/B test.
Definitions of size/power calculations in A/B tests: A size of a statistical test is the probability of encountering a false positive. The power of the test is the probability of correctly finding the difference between treatment and control.
The formula of calculating sample size for a test with two alternatives is as below:
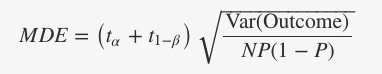
Here t(k) is a critical value to reject hypothesis with probability k according to a t distribution, α and 1−β are size and power of the test. MDE is the minimum detectable effect of the experiment, N are the number of users in the test, P is the fraction assigned to the treatment group and Var(Outcome) is the variance of the outcome metric you are using to decide if the test is successful or not. Full details of the calculations can be found in this GitHub link posted by the author of the analytics skills book.
Two key takeaways from this calculation:
- The noisier the outcome metric chosen, the larger the sample size needed for each recipe of the test required, hence the test needs to run longer to achieve statistical significance.
- The smaller the MDE between alternatives, the more the sample size required to conclude the test result with a high statistical significance.
Lets’ calculate the sample size that is required to achieve a given MDE with an example. Lets’ say your hypothesis is that if we provide a discount of 10% of the seasonal products on your catalog, the sales will increase further. Since there is a variety of products in the seasonal category, the variance (Var(outcome)) is at $ 6000 (Standard Deviation S is about $ 77). We choose the size and power (5% and 80%).
In discussions with business team, we came to a conclusion that the alternative would only make sense if we see a minimum effect (MDE) of $ 11 (or 15% of 1 standard deviation (s)). Assuming we run both the alternatives at 50%, when we run our size calculator, we use the formula as below:
N = ((t_alpha + t_oneminusbeta)^2 * var_outcome)/(MDE^2 * P * (1-P))
Calculating t_alpha and t_oneminusbeta from size and power values need the degrees of freedom input as well, I will not include those details in this article. Details of the calculation are also present in the GitHub link as mentioned earlier.
Based on the above formula, we see that we need at least 1,228 participants in the experiment. If we have anything lesser than this number, our outcome would be prone to a type I or type II error, which is not desirable.
In the above example, lets assume that we are going to provide the discount offer for seasonal products in an email and the average open rate of emails is around 5%, then to get at least 1,228 participants for our experiment, then we'll have send around 24,560 emails to achieve statistically significant MDE. Since you know the math now, you can objectively tell the email ops team to select an audience that meets the sample size criteria.
One another resource that is available for running the size and power calculations is this link: https://docs.adobe.com/content/target-microsite/testcalculator.html. Feel free to use the size and power calculator available on this link to estimate the performance of your prospective A/B test, so you don’t have to run complex size and power calculations offline before ranking your A/B tests in the order of impact.
Here is a great explanation about the various statistical inputs that are used for calculating the outcome of an A/B test: https://experienceleague.adobe.com/docs/target/using/activities/abtest/sample-size-determination.html. It gives a good understanding of the under the hood calculations.
Now that we have a basic understanding of the size and power calculations, let's make it a practice to estimate the sample size before qualifying the hypothesis for A/B testing.
Originally published: Jul 13, 2021