
Beyond Aesthetics: 3 Ways Adobe Analytics Can Quantify Creative Performance
In creative marketing, quantifying the ads’ influence on website traffic, performance optimization, or even business impact is often overlooked. But there are ways to measure it with the right tools and data-driven mindset. Using Adobe Analytics for ads optimized for link clicks or landing page views, we can view creatives beyond aesthetics and drive a more objective approach in identifying campaign effectiveness. This is when campaign tracking codes are certainly most helpful!
3 Ways Adobe Analytics Can Quantify Creative Performance
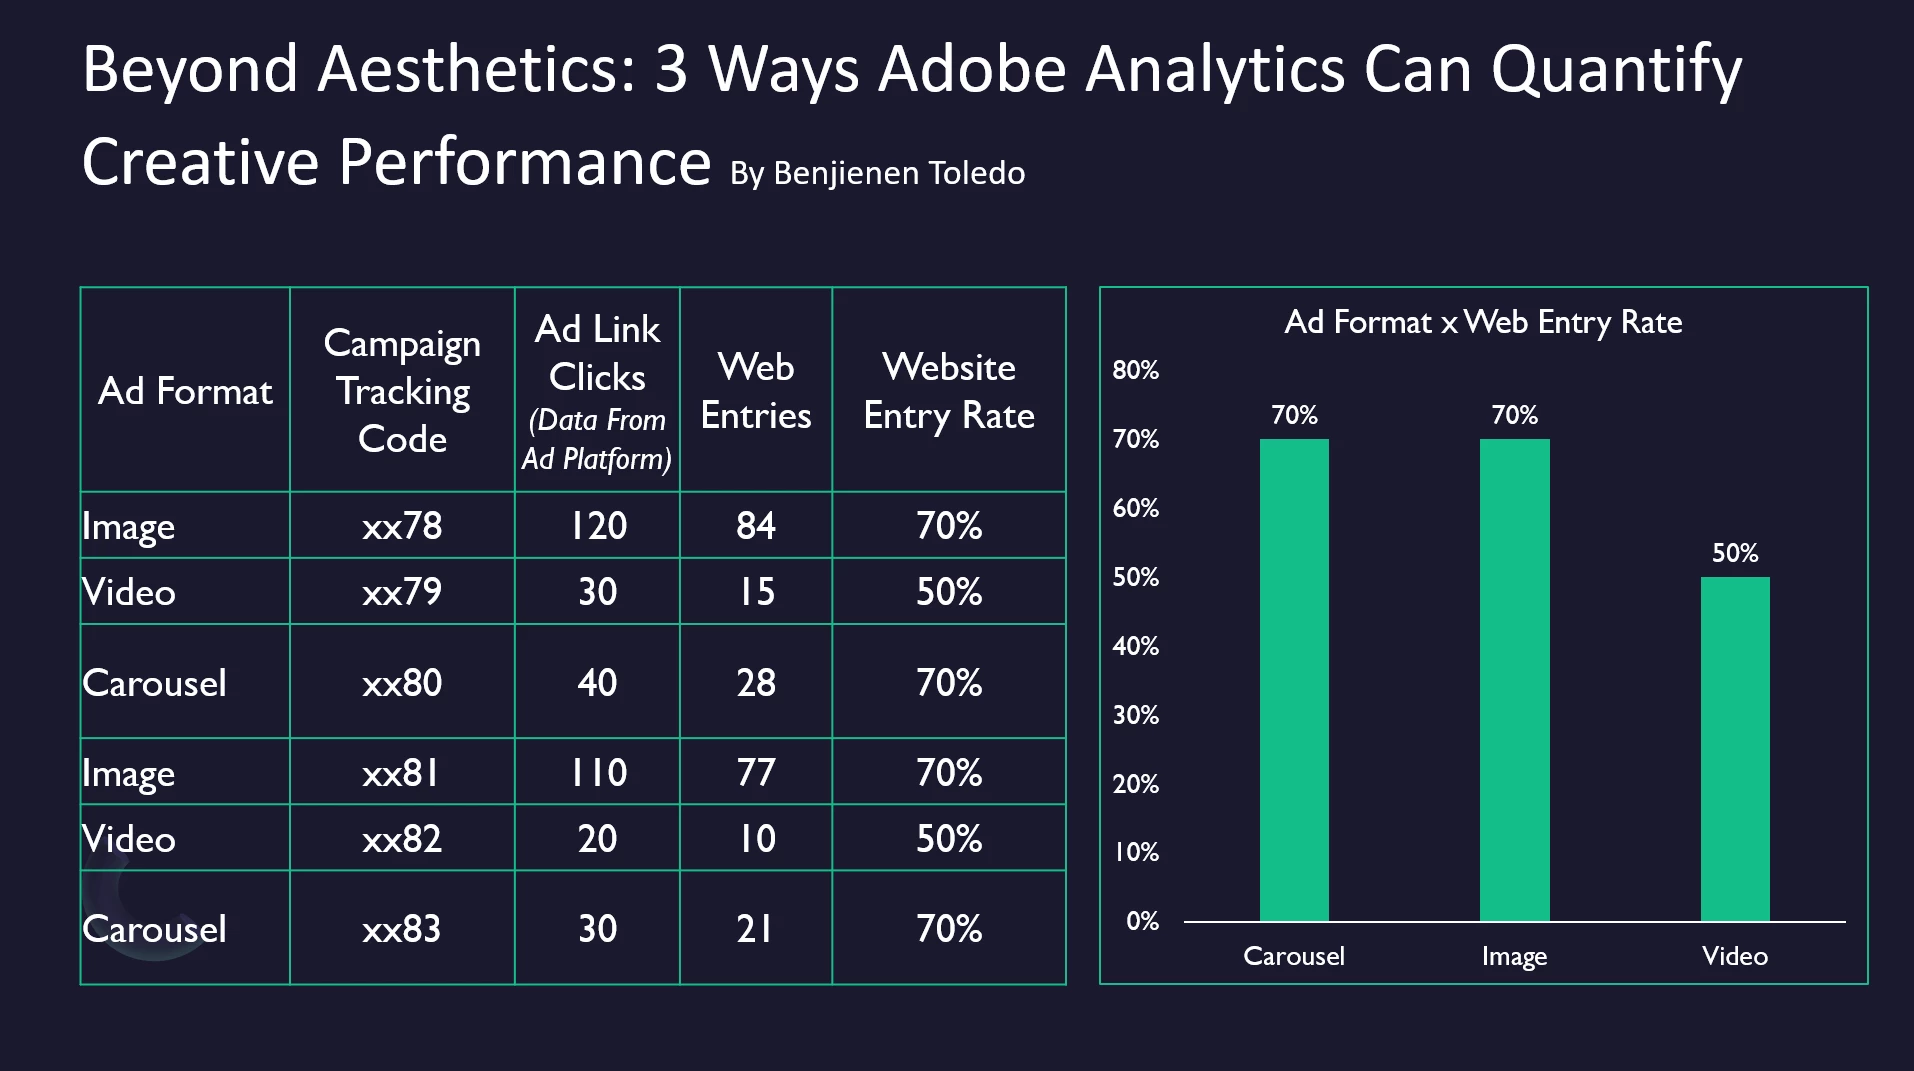
1. Identify the Best Ad Format Which Brought the Highest Traffic and Desired Website Events
Based on the data set below, despite the Carousel ad format having lesser web entries than Image ads, but in terms of website entry rate, it performed as good as image format. While Videos had the lowest website entry rate. From various digital campaigns I’ve seen, this is expected since the priority for video ad formats are not for link clicks but more towards video views. But you can compare this with your organization/company’s benchmark.
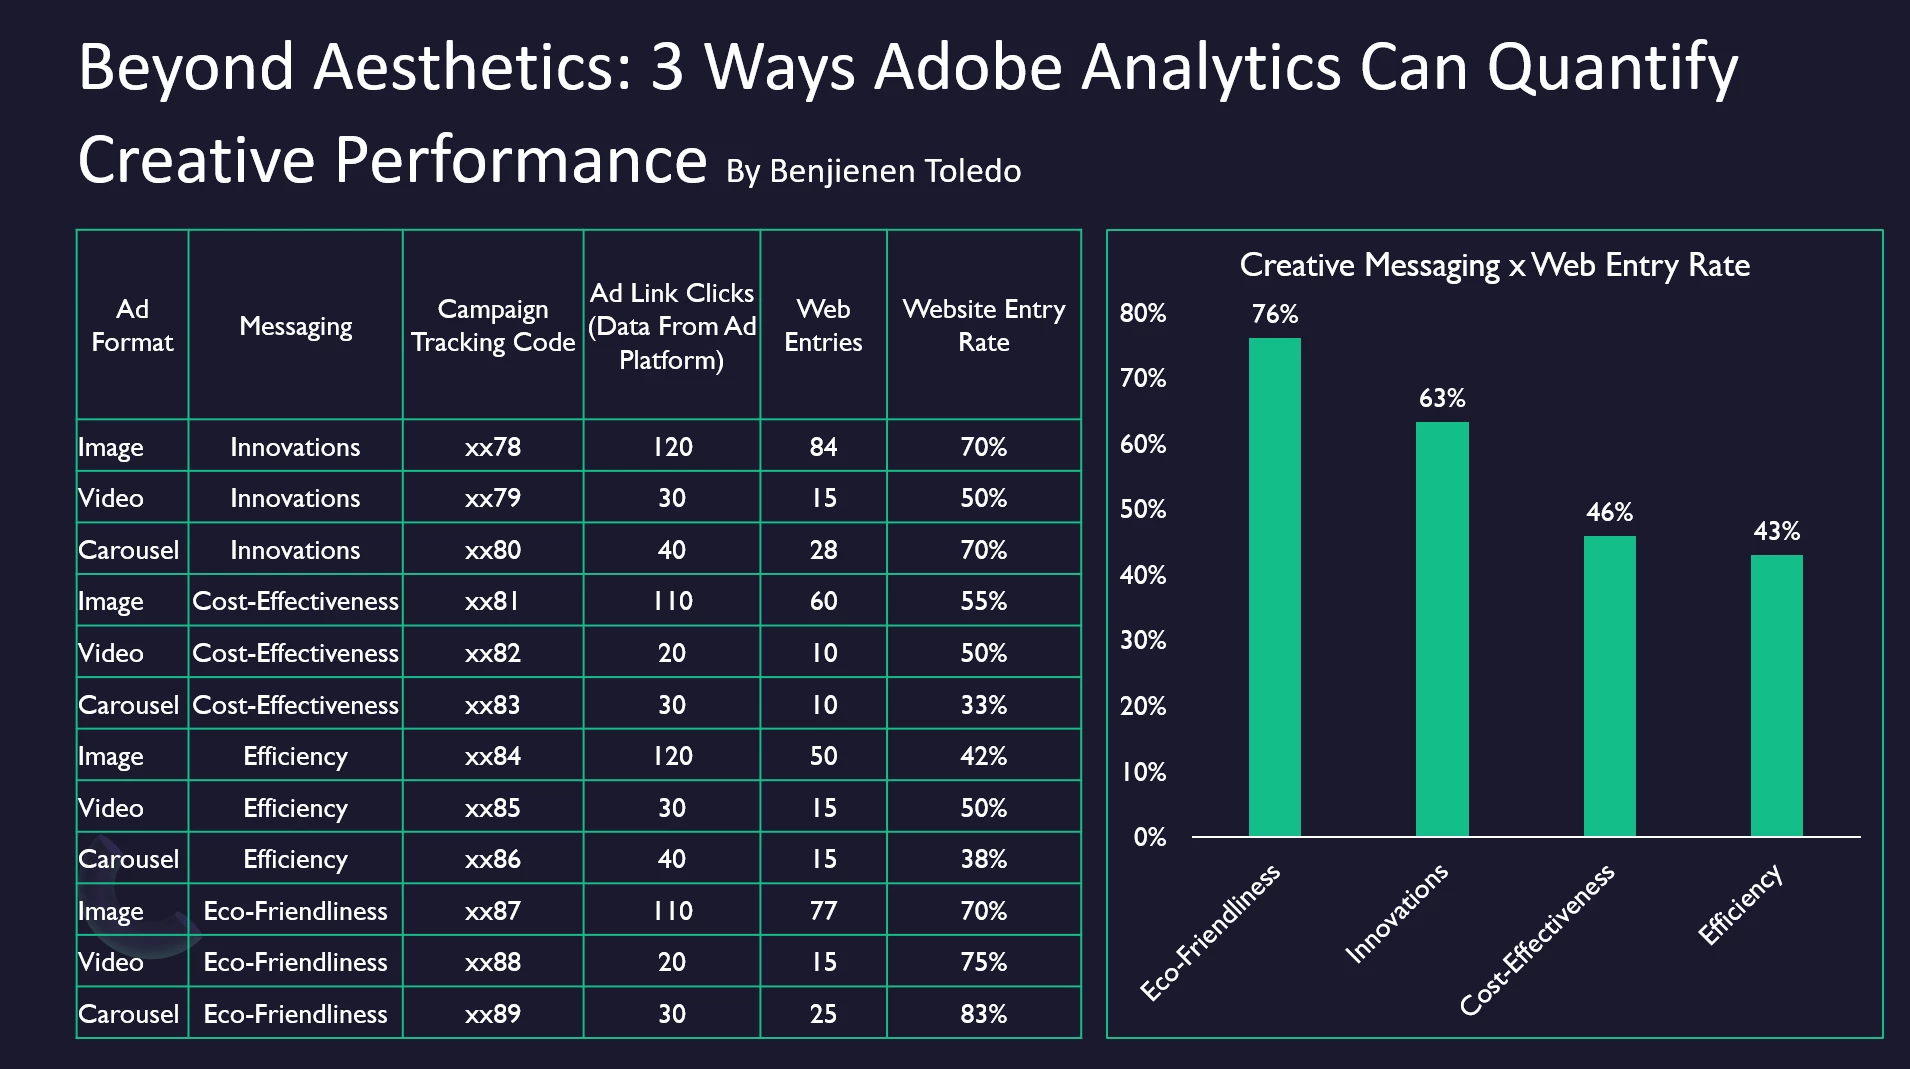
2. Understand the Preferred Messaging or Creative
Regardless of ad format, you can understand which creative messaging compelled your audiences to learn more and entered the website. From the example below, it may be unexpected how Eco-friendliness is the most preferred creative theme. This representation can support your content and creative teams to produce similar messaging not just because it feels right, but it is backed by data.
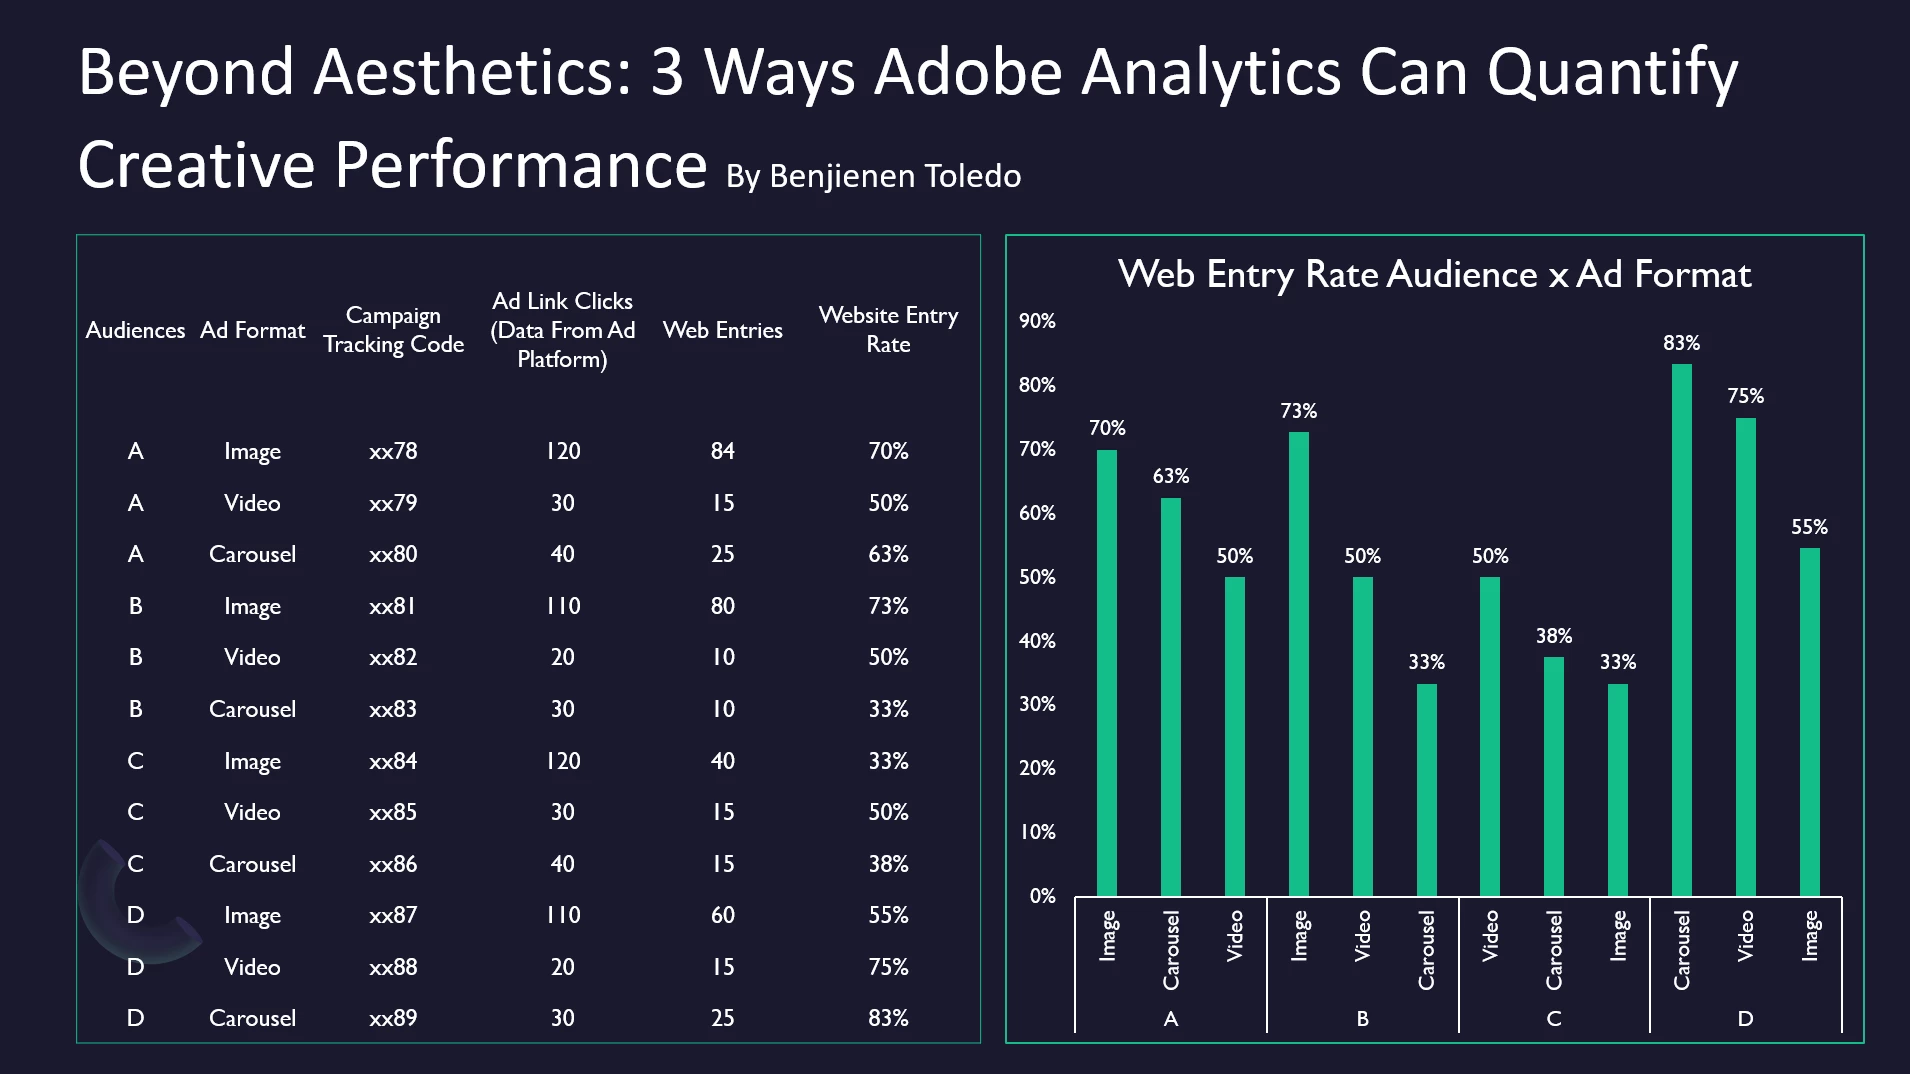
3. Recognize Which Creative Format or Messaging Resonated to Your Audiences
You can either analyse your audiences and the ad format or the audiences and the creative theme or messaging. These will help your media managers decide on the best ads combination for each of your audiences.
In the first example below, it shows that audience A & B resonated best to Image format, while Audience C preferred Video, and Audience D had the highest website entry rate from Carousel ads.
In another example below from the same data set, the top creative themes were also different per audience:
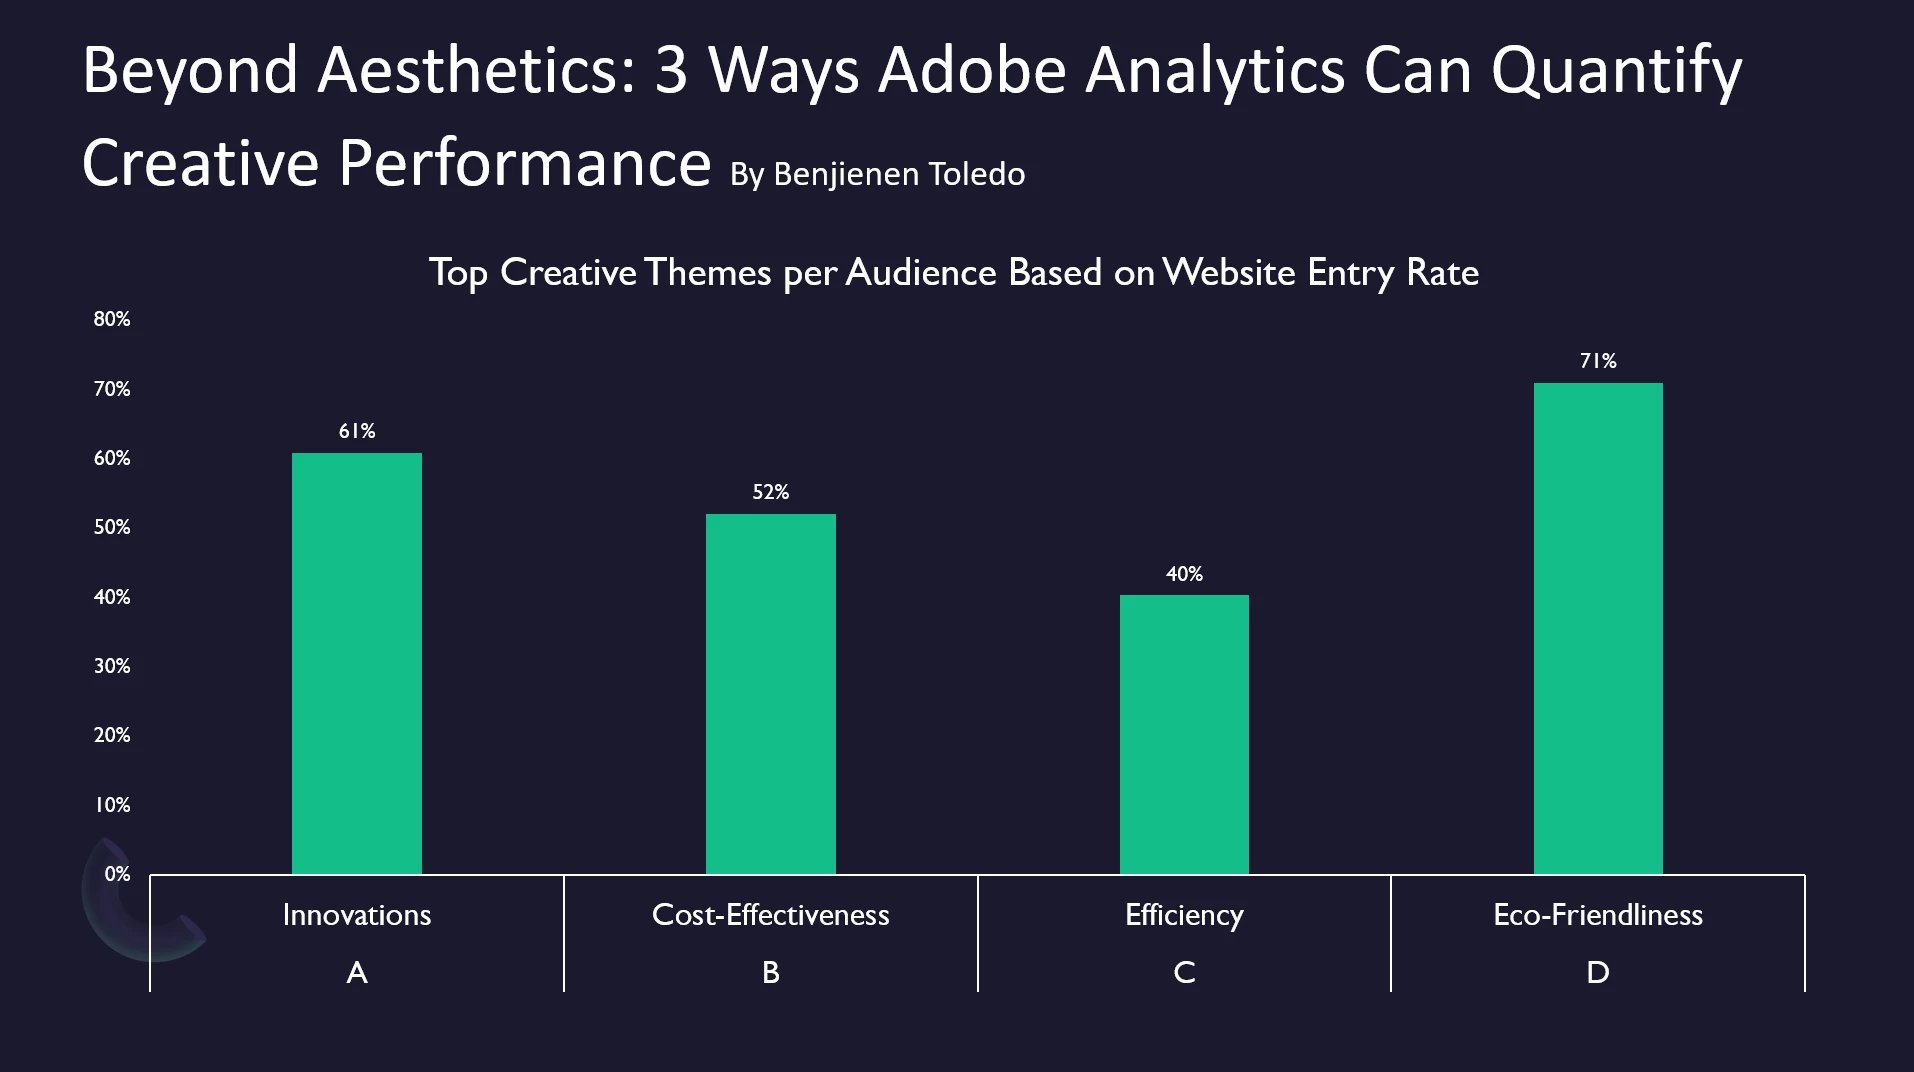
All these strengthen your ad optimisation recommendations and provide empirical data to your creatives team. Measuring the impact from what looks good to what performed well. This is a key to engage your designers in analytics!