Navigating B2B Landscape with Real-Time Customer Data Platform Insights Dashboard
Authors: @kumarsameer , @pratibhas
Reviewers: @saswataghosh, @kniwa, @rishabhc, @erikru & @ruchita_ghaskadvi
If you’ve worked with the Adobe Experience Platform (AEP) B2B data model, you know it offers a wealth of opportunities for gaining valuable insights. Adobe’s Account Profiles Dashboard within AEP is a powerful tool designed to help businesses harness the full potential of their B2B data.
In this blog, we’ll explore how to effectively use the Account Profiles Dashboard to maximize its benefits. We’ll walk you through the key fields and widgets and offer guidance on how to leverage this dashboard to enhance your business strategies.
What’s inside the Account Profiles Dashboard?
Imagine having a tool that aggregates all your B2B data into one cohesive presentation, giving you a crystal-clear view of your accounts. That’s what the Account Profiles Dashboard in AEP does. It’s your go-to for analyzing and visualizing account data, refining your marketing strategies, enhancing customer relationships, and boosting revenue growth.
On top of the dashboard, there is a date picker that helps you filter out widgets for the specific date range that you specify.
Here’s a sneak peek at some of the widgets and what they reveal:
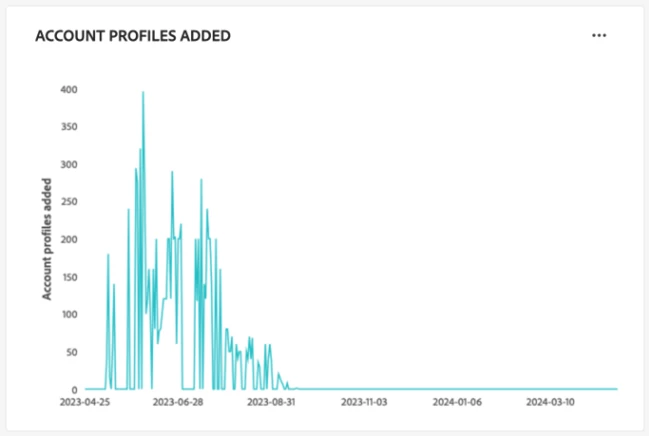
- Account profiles added: Ever noticed spikes in your account profile additions? This widget helps you track these trends, showing you the impact of your recent campaigns or outreach efforts. It’s like having a direct line to your campaign’s success rate.
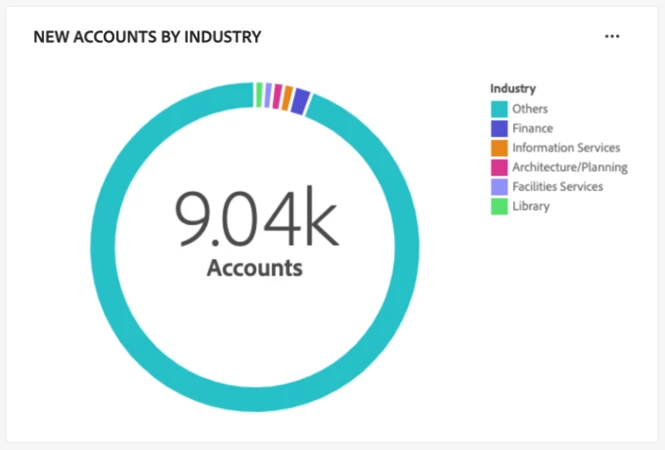
New Accounts by Industry: Curious about which industries are driving your new account creation? This widget breaks it down, letting you focus your marketing efforts where they’re most effective or spot opportunities in underrepresented industries.
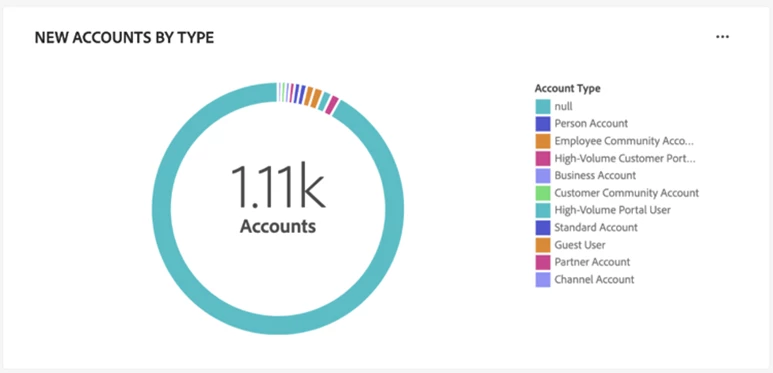
New Accounts by Type: Want to know which account types are the most popular? This widget helps you understand your accounts based on account types and adjust your strategies accordingly, whether it’s targeting specific account types more aggressively or balancing your approach.
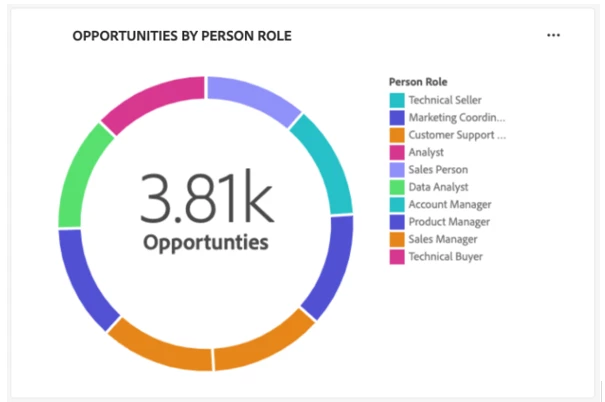
Opportunities by person role: This widget helps businesses understand which roles within organizations are driving the most opportunities. By identifying key decision-makers or influencers, companies can tailor their outreach and communication strategies to target these roles more effectively, maximizing conversion rates and improving relationship management.
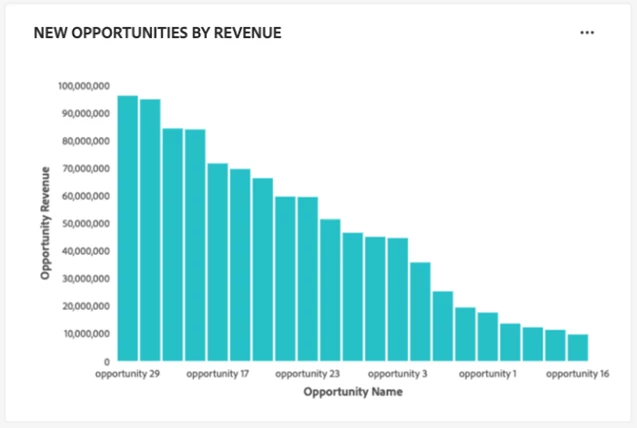
New opportunities by revenue: By visualizing the revenue potential of new opportunities, businesses can prioritize high-value opportunities and allocate resources more efficiently. This insight helps in assessing the financial impact of ongoing deals and guiding strategic focus toward opportunities that offer the greatest revenue potential.
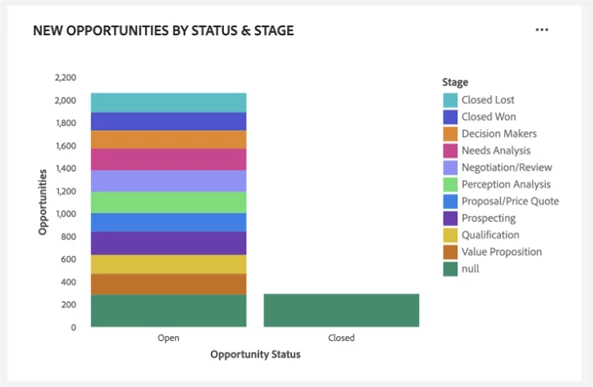
New opportunities by status & stage: Get a clear view of where your opportunities stand in the sales funnel with this widget. It helps identify bottlenecks, track progress, and forecast potential revenue—essential for refining your sales process.
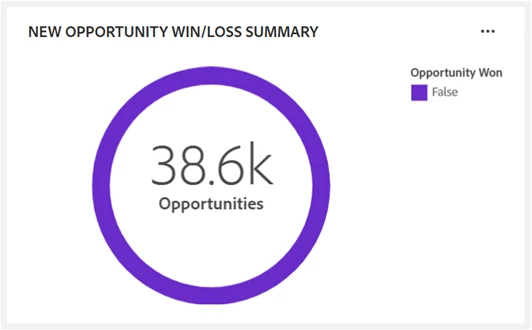
New Opportunity Win/Loss Summary: Measure the success of your sales or marketing efforts with this widget. It’s a quick way to see how many opportunities you’ve won, offering insights into what’s working and what might need a little tweak.
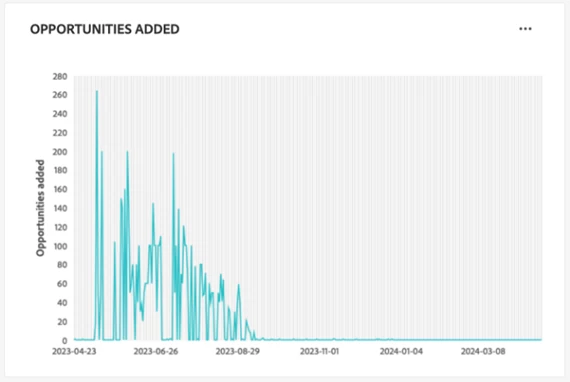
Opportunities added: Track how new opportunities are flowing into your pipeline over time. This widget helps you gauge the effectiveness of your lead generation efforts and adjust your strategies to keep that pipeline thriving.
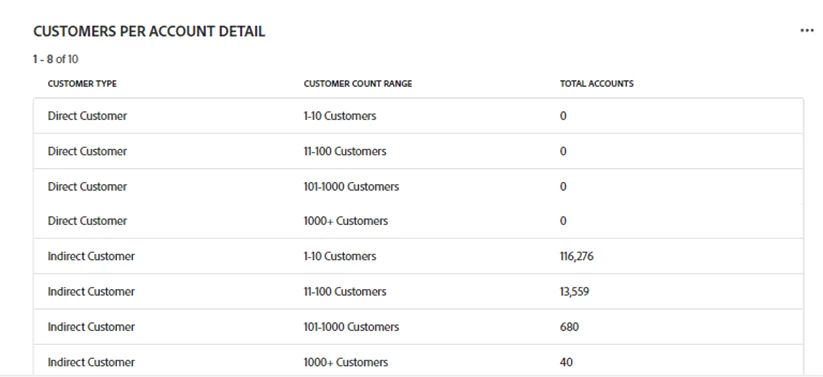
Customer Per Account Detail: This widget categorizes accounts based on customer type, which defines how an individual person profile is associated with an account profile. The classified either as Direct Customers, who are directly associated with an account through a person component, or and Indirect Customers, who are linked through an account-person relation table. It shows the number of accounts within different customer count ranges. It provides quick insights into account distribution, helping identify growth opportunities and optimize customer engagement strategies.
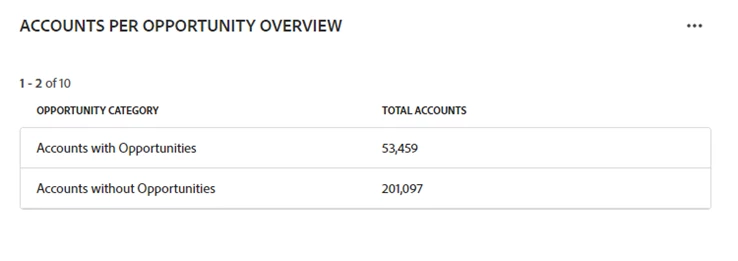
Accounts per Opportunity Overview: This widget shows the number of accounts with and without associated opportunities. It helps quickly identify potential areas for growth by highlighting accounts that might need more attention or nurturing to unlock new opportunities.
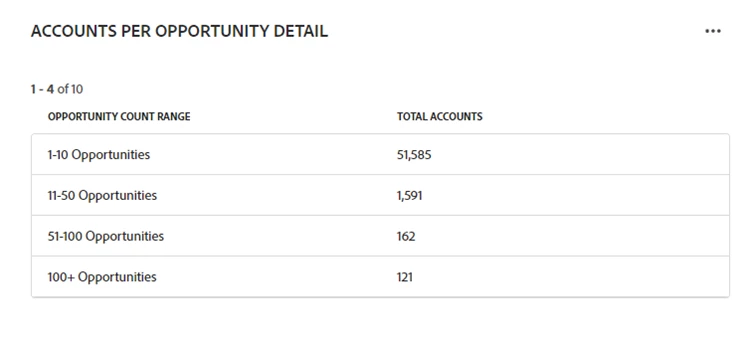
Accounts per Opportunity Detail: This widget displays the total number of accounts across different opportunity count ranges. It provides a clear view of how opportunities are distributed among accounts, helping identify where the most potential lies and prioritize engagement efforts accordingly.
Check out the Account Profiles dashboard on Experience League for a deep dive into these widgets.
Which data drives the dashboard?
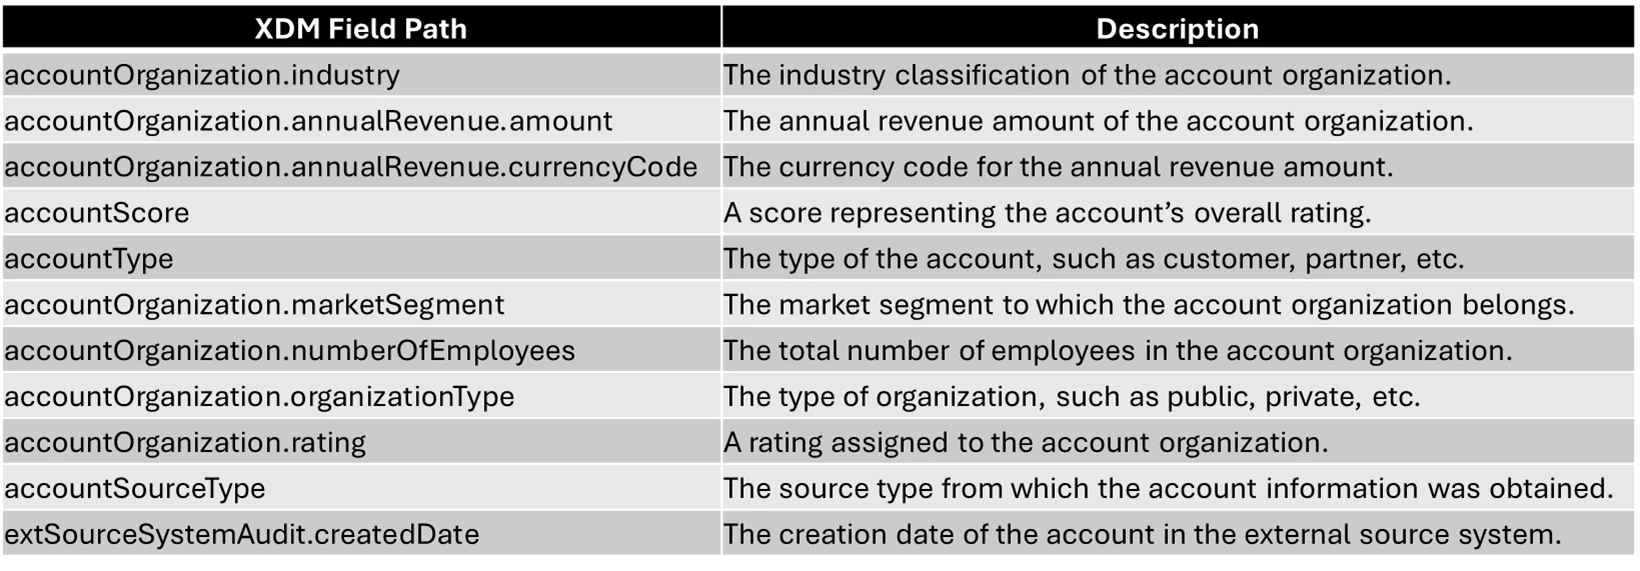
To get these insights flowing, make sure you’re populating the right B2B schema attributes:
B2B Account
B2B Account Person Relation

B2B Person

B2B Opportunity
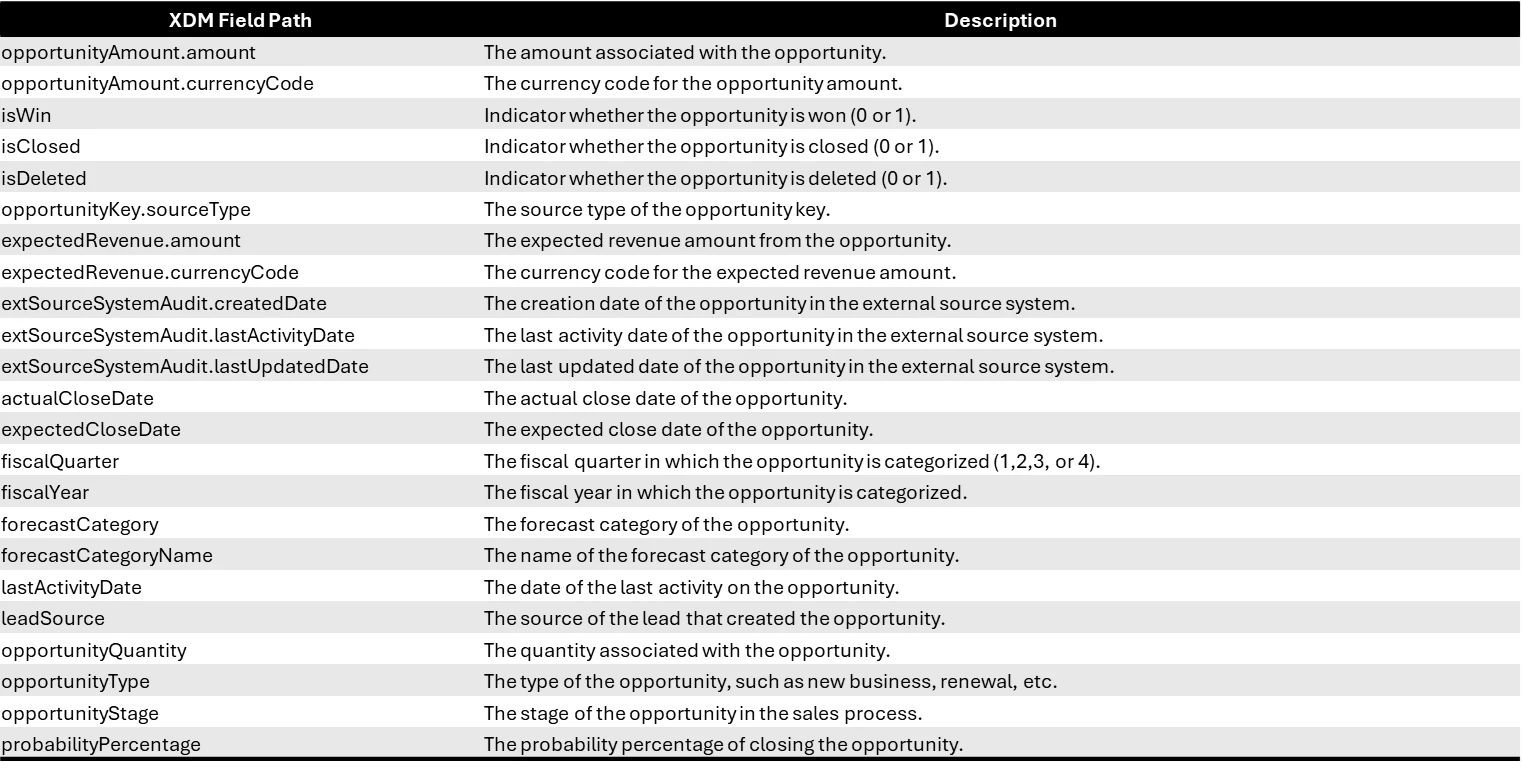
B2B Opportunity Person Relation

Right now, the dashboard utilizes these three schemas but keep an eye out—schemas like B2B Campaign and B2B Marketing List might be added for even more insights in the future.
Things to Consider
- Leverage Out-of-the-Box (OOTB) Schema: Maximize the functionality of B2B features like Insight Dashboards and Account Segmentation by utilizing the OOTB schema within Adobe Experience Platform (AEP).
- Avoid Modifying OOTB Relationships: It's not recommended to alter the predefined relationships in the B2B OOTB schema, as this can lead to unintended complications.
- Thoroughly Analyze Customer Data: Before ingesting customer data into the B2B schema, ensure a comprehensive understanding of both the data and its relationships to maintain accuracy and efficiency in your segmentation efforts.
- Ensure Proper Population of OOTB Fields: It's essential to correctly populate the designated fields in the B2B OOTB schema to accurately reflect data in the Insight Dashboard.
- Leverage Custom Dashboard: The B2B Insight Data Model can be leveraged to build a custom dashboard, aligned with specific project and use case requirements.
Conclusion
The Account Profiles Dashboard in Adobe Experience Platform is like a key to unlocking valuable insights from your B2B data. By making sure the relevant fields in the B2B schemas are filled out correctly, you can reveal powerful visualizations that make it easier to see the bigger picture. These insights can be incredibly helpful for making informed business decisions, enhancing customer interactions, and achieving success in the B2B world. Also, the B2B Dashboard helps ensure data quality by identifying potential gaps, and providing accurate and complete data insights for better decision-making.
Resources:
- Account Profiles dashboard
- Account profile UI guide
- Account profiles overview
- B2B namespaces and schemas | Adobe Experience Platform
- Default Guardrails for Real-Time Customer Data Platform B2B Edition | Adobe Real-Time Customer Data Platform
- Schemas in Real-Time Customer Data Platform B2B Edition | Adobe Real-Time Customer Data Platform
- Mastering Consent Analysis in Adobe Real-Time CDP: A Guide to Building Your Customized Insights Using Data Distiller
- A Guide to Building Custom Insights Data Models in the Accelerated Store with Data Distiller
- Create a custom dashboard in AEP

