
Building 360-degree view of Customers in CJA for the Retail industry
In today’s retail industry environment, millions of data points are collected every second from different sources like online web/ app data, stores data, brick-and-mortar stores, etc. While trying to understand customer behavior across various channels, interacting with and stitching together in one place has always been a nightmare for brands. What if I tell you that you can collect data sources at one point and stitch them together in one platform? Boom! You are ready to analyze your customers and build a 360 view. This blog will help you do that. Connect every single customer touchpoint and visually explore comprehensive journeys in real-time in CJA to give your marketing teams the insights they need to build incredible customer experiences at scale.
What is CJA?
Customer Journey Analytics combines data from disparate channels into a journey-centric view that empowers Analysts and Marketers to quickly find answers to critical business questions, identify the right audiences for activation, and measure impact more holistically.
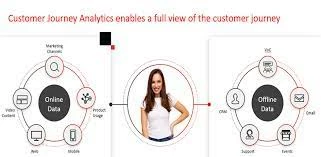
Customer Journey Analytics consolidates online and offline data into a single analysis infrastructure to provide a 360º view of the Customer. With the ability to attribute online activities to offline conversion (and vice versa) — you can establish an accurate picture of visitor conversion and the effects of your campaign investments.
Marketers and Analysts are empowered to find insights to critical business questions quickly. Now, they can segment customers and optimize marketing tactics, taking into account all data attributes and activities to drive optimal results. Consolidating all the data sources would provide a clear 360 view. Adding additional channels to the digital analytics data enables deeper discovery and provides unique and powerful insights that can have a significant impact on the business.
In this case, I have picked up the Retail customer, my favorite. Luma(https://luma.enablementadobe.com/content/luma/us/en.html). Luma has the below set of data sources
.Web Site
.Mobile App
· Offline Store purchases across the US
· Loyalty Data
· CRM Data
These different data sources need to be imported into AEP datasets. These datasets are stitched together by timestamp + a common person ID that we determine for each dataset. These datasets are combined in CJA Connections, and the Connections data is exposed via Data Views. These data views are then explored using Analysis Workspace (like traditional adobe analytics)
Let’s look at stitching all these data sources in CJA and build a customer 360 view.
Prerequisites:
· Access to AEP: Datasets, schemas
· Data sources ingested into AEP
· CJA: Access to data views, and connections (requires Product Administrator access on CJA).
Below are the steps that you can follow to build the cross-channel stitching in CJA
Step 1: Data Ingestion
You can ingest data into AEP using multiple methods — Batch Ingestion & Streaming Ingestion method.
Let’s look at how to ingest each of these data sources
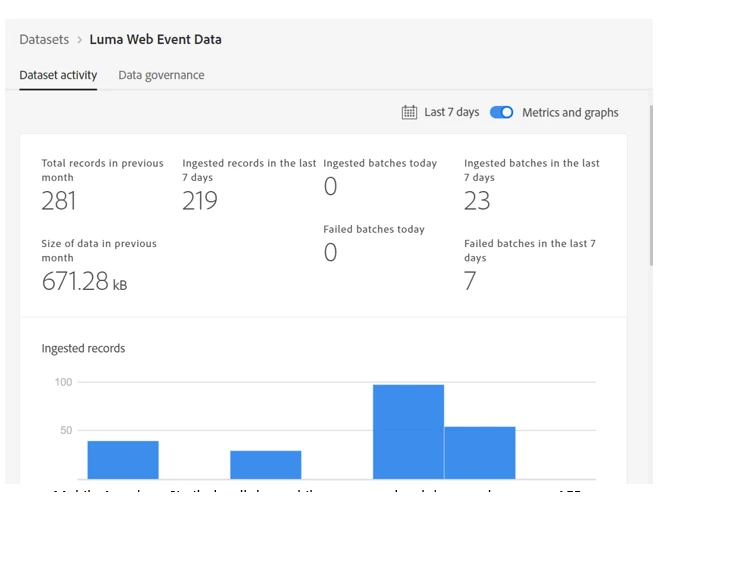
Website data: If adobe analytics is implemented already, you can use Adobe analytics source connector to ingest data into AEP datasets through batch ingestion. If you are using AEP WEB SDK, you can send data to the AEP Edge network directly. As you can see in the below screenshot, ‘Luma Web Event Data’ is the dataset that I have created to collect the website event data using Adobe Analytics source connector.
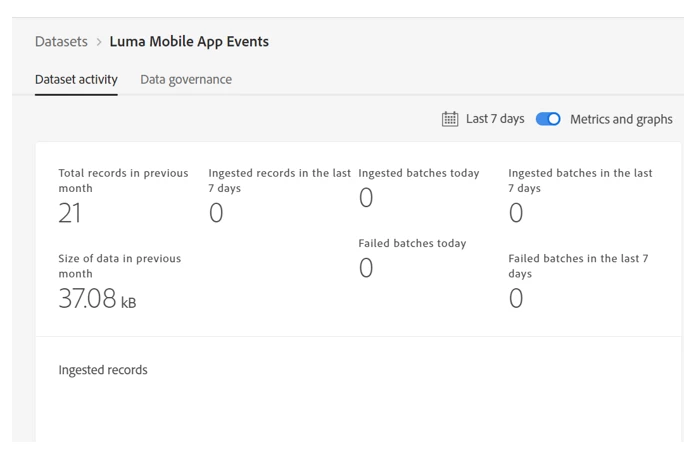
Mobile App data: Similarly, all the mobile app event-level data can be sent to AEP using either the Adobe analytics source connector or through the edge network. Below is the snippet of the dataset, which collects all the Luma mobile app data using the Adobe Analytics source connector.
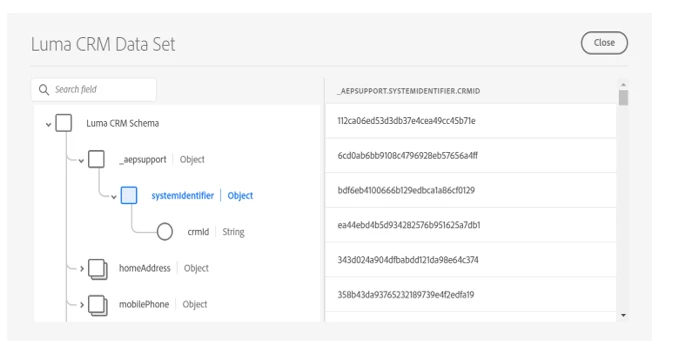
CRM Data: Unlike web and mobile data, for CRM data, I have multiple ways to ingest the data files. We can directly upload them into the datasets or have Amazon S3 configured or can run an API to ingest this data. In this case, I have directly uploaded the JSON files into the dataset. Below is the snippet of the preview of the dataset.
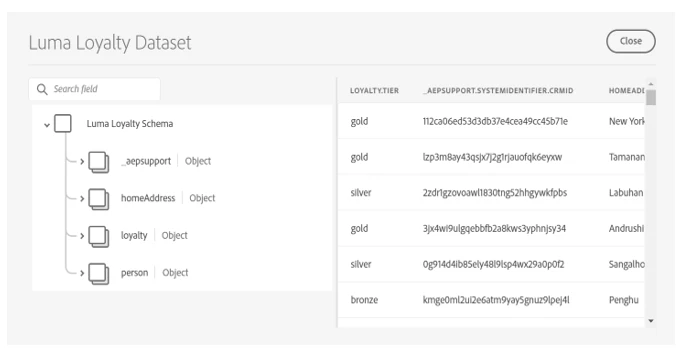
Loyalty Data: Have ingested Loyalty data similarly to CRM dataset using a JSON file. Below is the preview of the loyalty dataset.
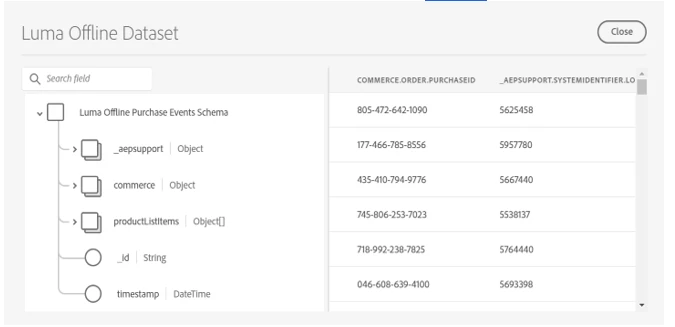
Offline Store Purchase Dataset — Ingested same as above examples
Now that all the datasets are ingested into AEP. We are ready to combine the data in CJA.
Step 2: Create a Connection in CJA
Go to CJA > Connections > Create a new connection > Add Datasets
All the datasets created in Step 1 are selected as shown in the below snippet:
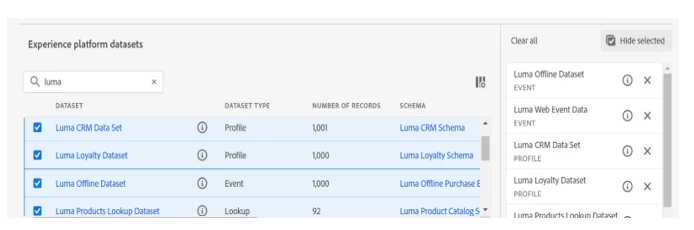
While creating the connection, the important field is the Person ID, which needs to be selected for each of these datasets. As mentioned, at the start of the post, the way we are combining the datasets is through Person ID. So, it is essential to have a person ID across all the datasets.
It is important to understand how CJA stitches these datasets. There are three types of datasets — Event Datasets, Profile Datasets, and Lookup Datasets.
When you create a connection, Customer Journey Analytics (CJA) unions all event datasets and enriches them with the profile and lookup dataset into a single connection. This ‘combined event dataset’ is what CJA uses for reporting. When you include multiple datasets in a connection:
.The ‘Person ID’ column of each dataset is grouped together, regardless of their name. This column is the foundation for identifying unique profiles in CJA.
· Rows in the event dataset are ordered by the timestamp fields.
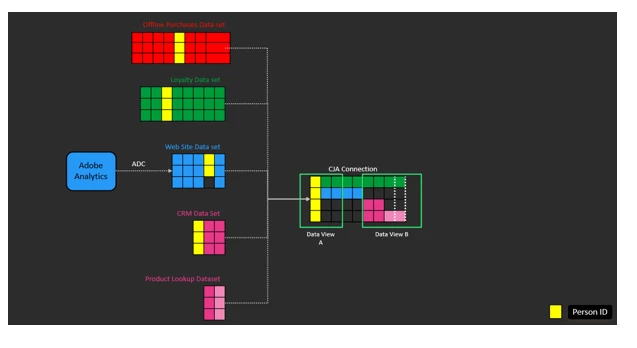
Below is the snippet of how the datasets are connected using Person ID in CJA connections
Let's look at our example
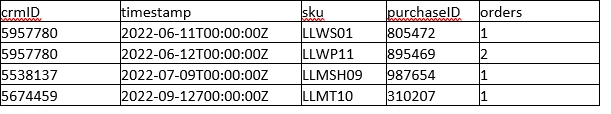
Luma Offline Dataset sample records
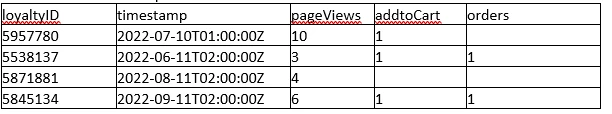
Luma Web Dataset sample records
The combined Dataset would look something like this
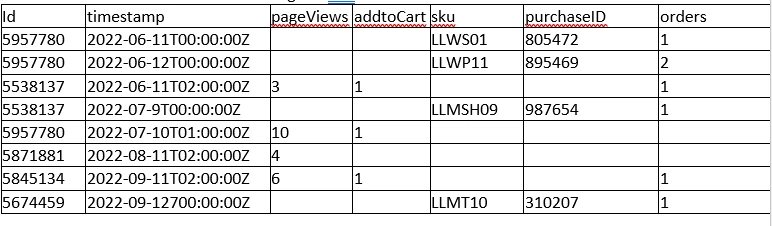
This combined event dataset is what is used in reporting in Data views in the next step. It does not matter which dataset a row comes from; CJA treats all data as if it is in the same dataset and rows are created in the ascending order of the timestamp. If a matching Person ID appears in both datasets, they are considered the same person. If a matching Person ID appears in both datasets with a timestamp within 30 minutes, they are considered part of the same session.
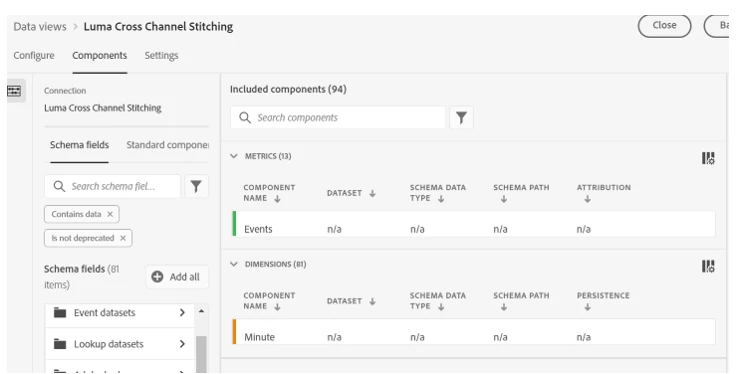
Step 3: Create Data views
Go to Data views > Configure > Select time zone > Select the Components.
Now we are ready to analyze the data and build amazing visualizations in CJA to understand different customer journeys.
Step 4: Visualization & Analysis in CJA
We can create various types of workspace projects with visualizations in CJA just like traditional Adobe Analytics.
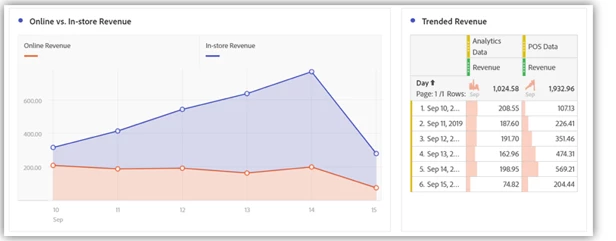
· Dashboard to establish a comparison between Online and POS revenue
· Visualize cross-channel journeys: You can visualize any brand touchpoint in the exact order it occurs. For example, study the journey of customers who called a call center, saw a display ad, and then visited the physical store.
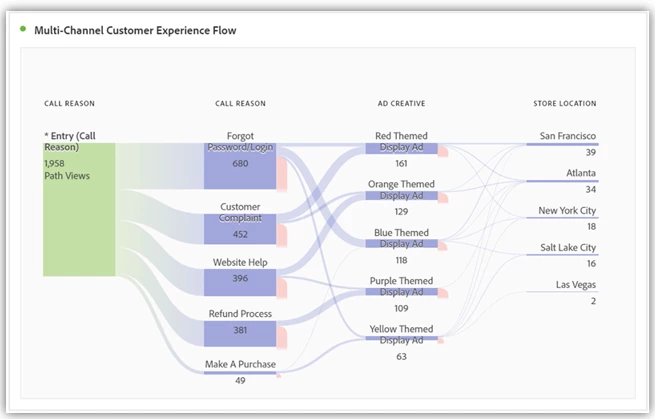
CJA is limitless in creating various dashboards for different use cases, and I can create dashboards at the Person level to see the customer journey across various channels.
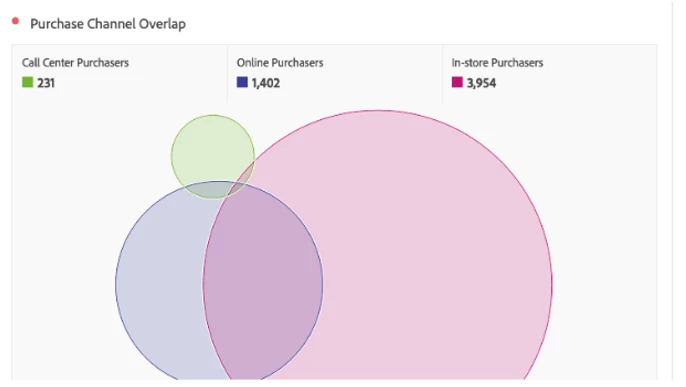
· Unified Purchasers: As you can see, the below screenshot gives the overlap of the purchasers between Online, In-store, and Call Centers. It is a powerful insight to be able to know the number of customers who purchase both online, offline, or even through a call center.
With CJA, I can report all my data in one place. In simplest terms, CJA is delivering cross-channel customer engagement insights. This may be through the lens of audience and segment identification, channel flow analysis, and/or cross-channel data analysis. I can then use these insights to identify new (or refine existing) audiences and segments, run experimentation, determine the effectiveness of engagement tactics, and explore a more holistic 360º view of customer interactions with Luma.
Reference Links:
· Insert data using the Adobe Analytics source connector
· Create Connections & Data views in CJA