If I use custom date ranges in a table and then link a Line visualisation, an error displays stating that only time series data can be displayed in Line & Area visualisations. Given that the custom date range is essentially a group of days, I'd expect to be able to use these and still run a Line graph off them.
You have visits as the metric in the table. For the line graph to work, the metric should be time-based one. Attaching a screenshot for your reference.
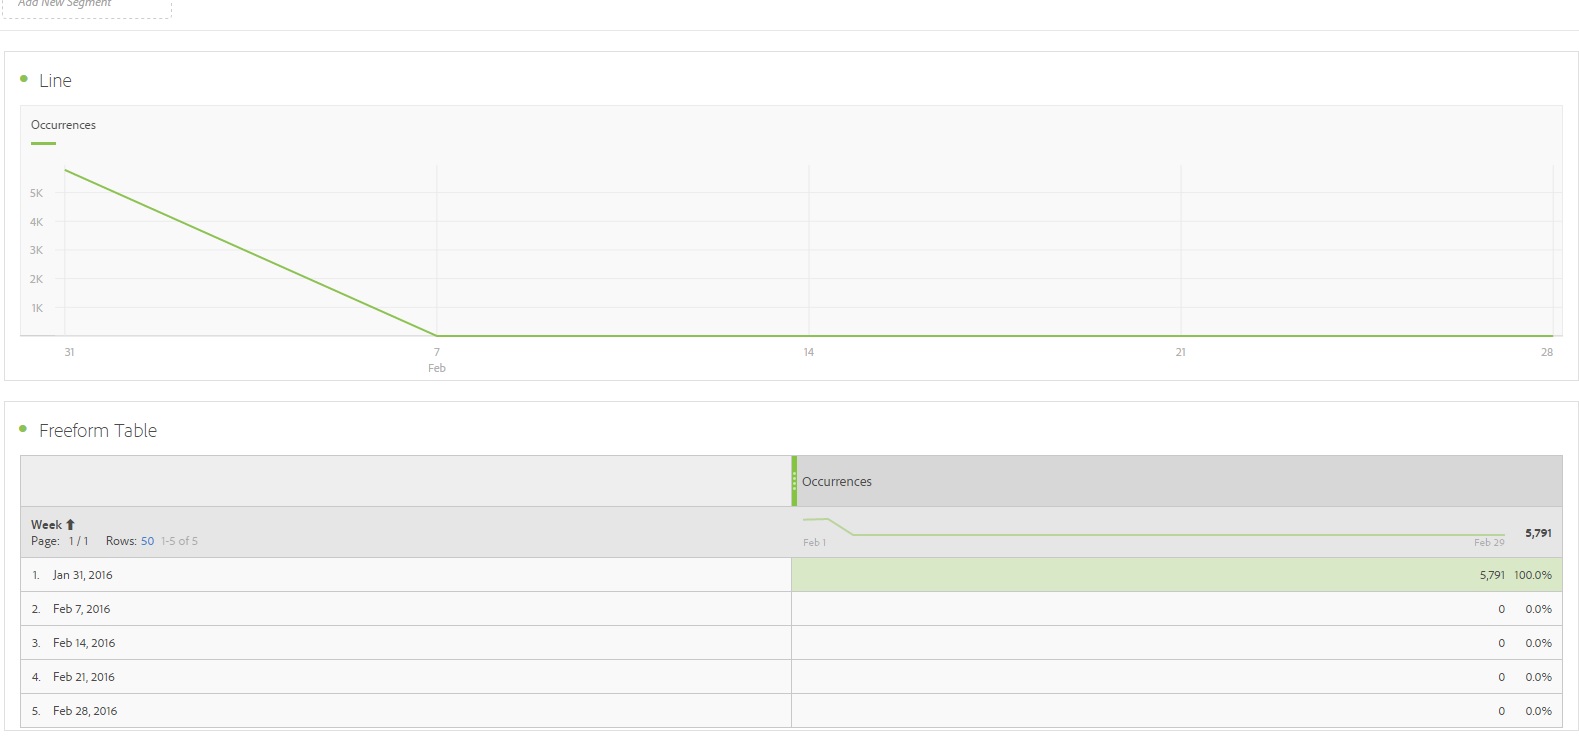
I have tried doing the same and I can see my line graph with a custom date range. If you could post a screenshot of your table I may be able to assist you better.
You have visits as the metric in the table. For the line graph to work, the metric should be time-based one. Attaching a screenshot for your reference.


