Strange behavour on Date ranges relative to panel
Hi! I use a customized date range for my panel (start > when the site was officially launched | end > rolling day - 1 day). There are some tables on which I have to apply a shorter date range (let's say, from October 30 until yesterday), so I created another date rage with these requirements (start > Oct 30 | end > rolling day - 1 day).
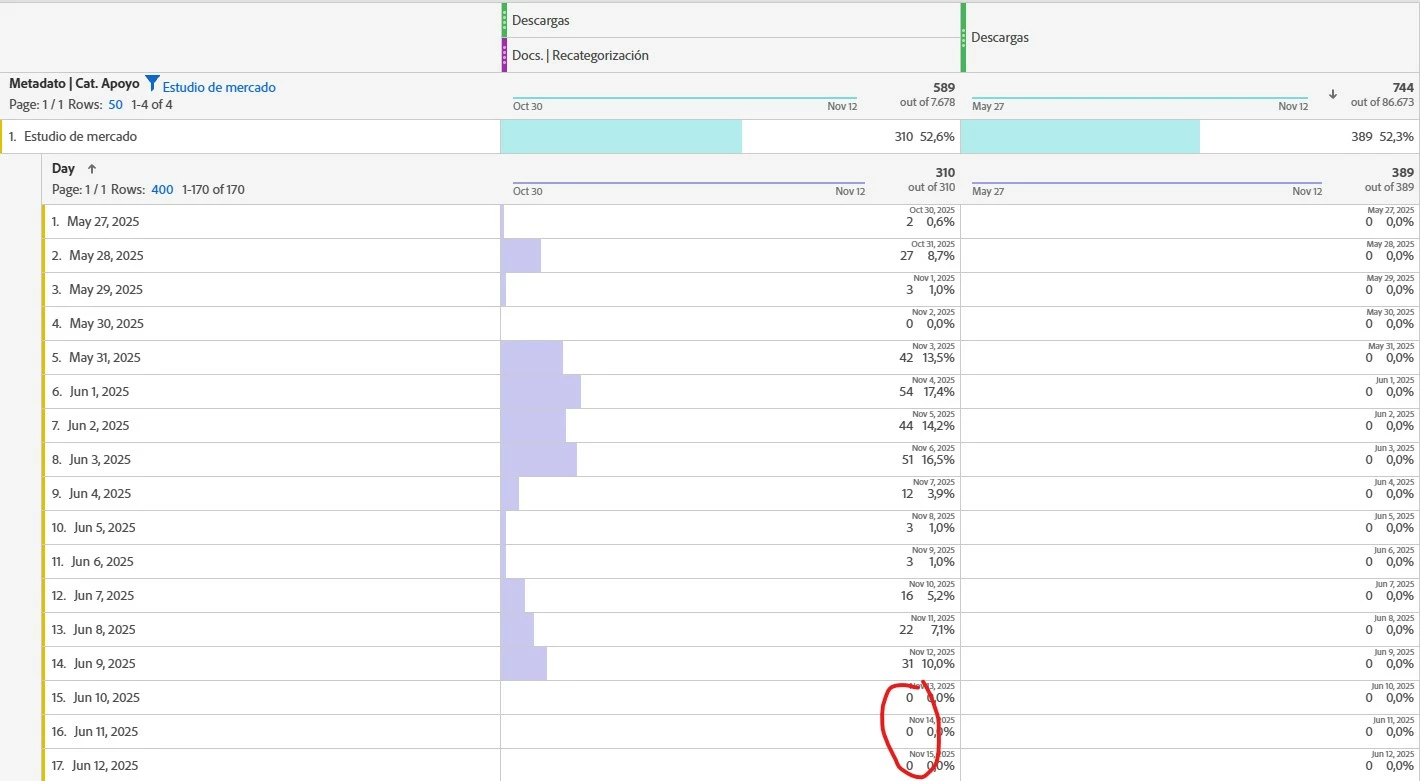
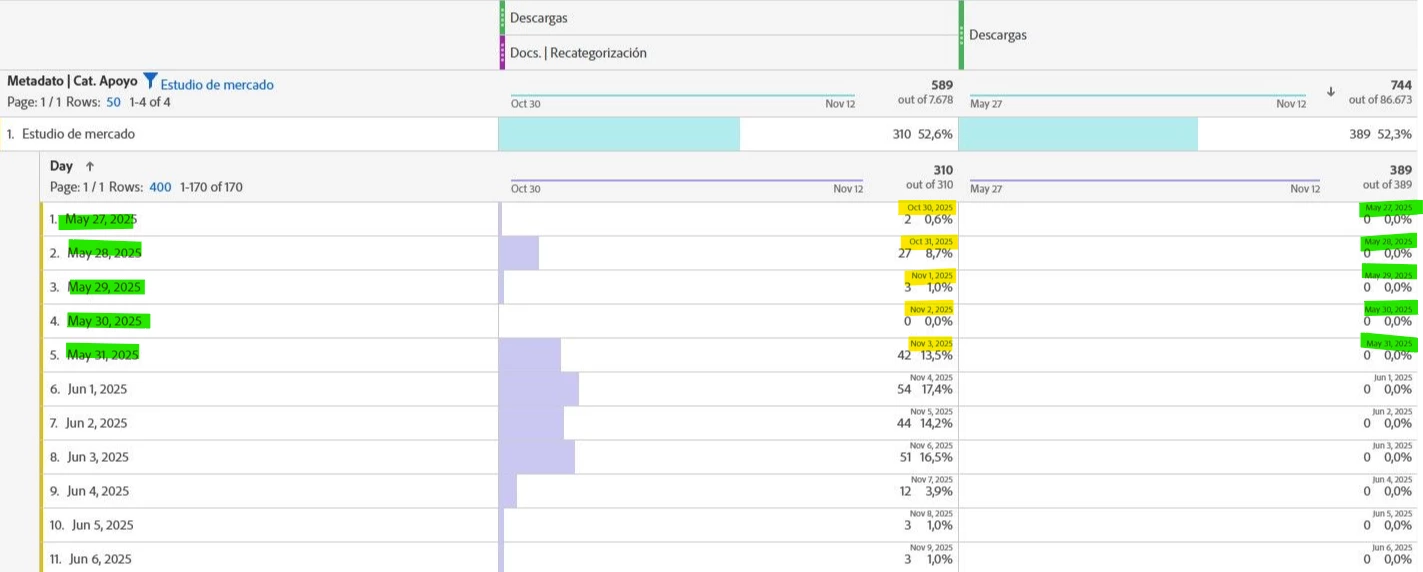
When I apply this new range to a metric, it seems to work for the total number, BUT if I breakdown by days, they don't make sense, because days outside this shorter date range get the credit. What AA is doing is that, if my shorter range has, for instance, 17 days, it allocates the values in the first 17 days of the panel date range:
In the following screenshot: Panel range > Nov. 29, 2023 until today (Nov 13). Shorter date range > Oct. 30 until yesterday (Nov 12), which is 13 days in total. As you can see, the first 13 days of the panel range get the values, though they are not in the segment applied. Any ideas?