Unable to see variable names from Adobe Cloud Debugger linked account
![]()
- Mark as New
- Follow
- Mute
- Subscribe to RSS Feed
- Permalink
- Report
Hi There,
I am wondering if anyone here has experienced the same issue like mine?
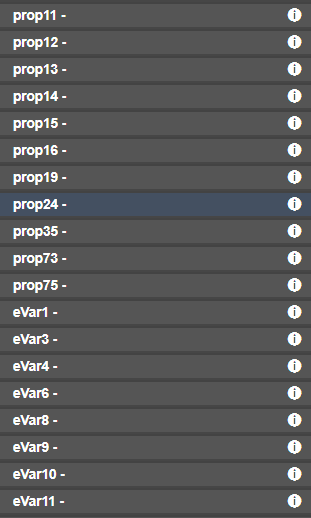
Current, I am unable to see the variable names from the debugger with my linked account signed in (see screenshot below).
So I have to open my workplace side by side to reference the corresponding name for each variable.
So far I have tried removing and re-installing the debugger chrome plug in, also logging in my account first, deleting all hits, and then refreshing the account....but nothings worked so far.
Hopefully someone can offer a new solution, thanks!
Solved! Go to Solution.
- Mark as New
- Follow
- Mute
- Subscribe to RSS Feed
- Permalink
- Report
The Adobe Experience Cloud Debugger is indeed an official tool developed and provided by Adobe, so it is as reliable as the DigitalPulse Debugger.
I would argue that it is more user friendly, since it provides friendly names for the evars and sprops. It also works with the rest of the Adobe Experience Cloud stack, providing debugging info for not just Analytics, but also Target, AAM, MCID, and more,
Here's a nice overview if you're not familiar with the tool: Debugging 2017.07 – Web Analytics for Developers
Views
Replies
Total Likes
![]()
- Mark as New
- Follow
- Mute
- Subscribe to RSS Feed
- Permalink
- Report
Hi Nikki,
Please use the below Adobe Debugger Tool, Just add the below code on "Bookmark" and use it. May I know hich debugger you are currently using?. Else go with omnibug from chrome extension, refre the below URL to add it in your extension.
javascript:void(window.open("","dp_debugger","width=600,height=600,location=0,menubar=0,status=1,toolbar=0,resizable=1,scrollbars=1").document.write("<script language='JavaScript' id=dbg src='https://www.adobetag.com/d1/digitalpulsedebugger/live/DPD.js'></"+"script>"));
Omnibug URL: Omnibug - Chrome Web Store
Views
Replies
Total Likes
- Mark as New
- Follow
- Mute
- Subscribe to RSS Feed
- Permalink
- Report
It looks like they are using the Adobe Experience Cloud Debugger: Adobe Experience Cloud Debugger - Chrome Web Store
Neither omnibug nor the Adobe Debugging Tool provide the functionality this user is looking for. Namely, instead of just prop12, they want to see the friendly name their organization has given prop12, e.g. prop12 - Time Parting (c12) or whatever they use it for.
I've had this issue with the Adobe Experience Cloud Debugger. I usually just log in again, close the debugger and/or restart chrome.
![]()
- Mark as New
- Follow
- Mute
- Subscribe to RSS Feed
- Permalink
- Report
Hey,
Better try to use the adobe given debugger then Adobe. It gives more reliable and friendly manner.
Jay.
Views
Replies
Total Likes
- Mark as New
- Follow
- Mute
- Subscribe to RSS Feed
- Permalink
- Report
The Adobe Experience Cloud Debugger is indeed an official tool developed and provided by Adobe, so it is as reliable as the DigitalPulse Debugger.
I would argue that it is more user friendly, since it provides friendly names for the evars and sprops. It also works with the rest of the Adobe Experience Cloud stack, providing debugging info for not just Analytics, but also Target, AAM, MCID, and more,
Here's a nice overview if you're not familiar with the tool: Debugging 2017.07 – Web Analytics for Developers
Views
Replies
Total Likes
Views
Likes
Replies
Views
Likes
Replies
Views
Likes
Replies


