Expand my Community achievements bar.

Join us for the next Community Q&A Coffee Break on Tuesday April 23, 2024 with Eric Matisoff, Principal Evangelist, Analytics & Data Science, who will join us to discuss all the big news and announcements from Summit 2024!
SOLVED

Question Re Cohort Analysis

Avatar

Level 1

I am trying to measure my campaign effectiveness for retaining users over time through cohort analysis.

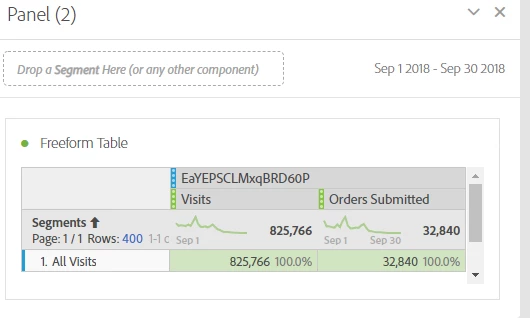
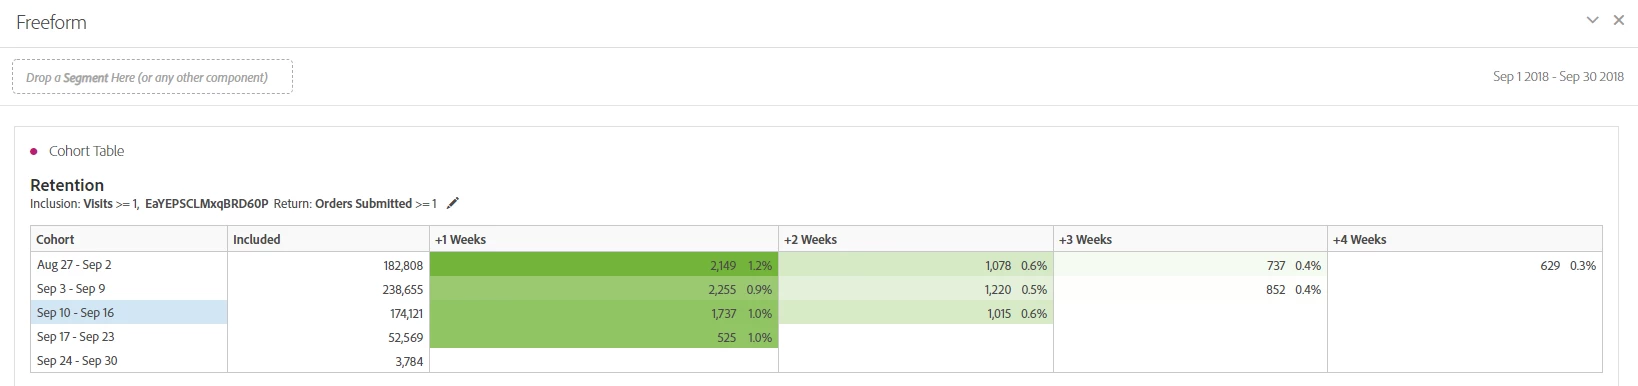
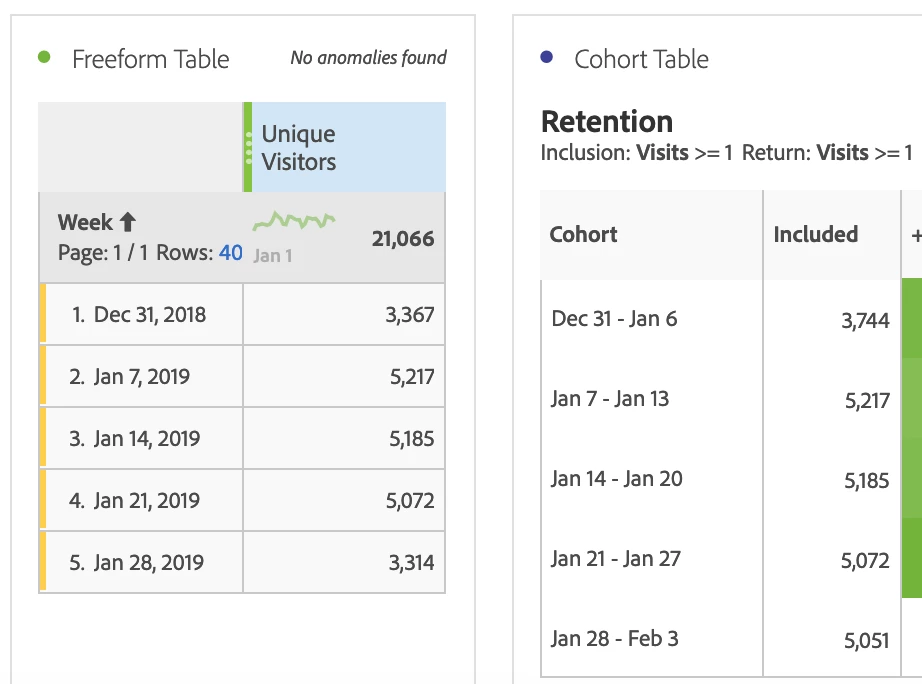
Even though, I'm using the same date range and parameters for Inclusion criteria, the data shown within the cohort table for both visits and orders are way below than when I build/pull it within a freeform table.

Does anyone know why and what is causing the gap?!

Thank you!

I've attached the screenshots if it helps:

1691821_pastedImage_0.png1691874_pastedImage_2.png

1 Accepted Solution

Avatar

Correct answer by
Level 10

Replacing Visits with Unique Visitors in the freeform table should fix the issue. However, I'm seeing a discrepancy anyway. Attaching another screenshot for a better week-by-week comparison:

The numbers do not match for the first and last weeks.

cohort.png

View solution in original post

2 Replies

Avatar

Correct answer by
Level 10

Replacing Visits with Unique Visitors in the freeform table should fix the issue. However, I'm seeing a discrepancy anyway. Attaching another screenshot for a better week-by-week comparison:

The numbers do not match for the first and last weeks.

cohort.png

Avatar

Level 1

I would be happy if my numbers were as close as they're shown in your week by week comparison : ) I could live with minor gap as long as data are aligned. The major issue is "orders submitted"; cohort table shows only 30% of numbers reflected in the freeform, now I am wondering which one is accurate?!