Calculated Metric for Average Page Views
Hello,
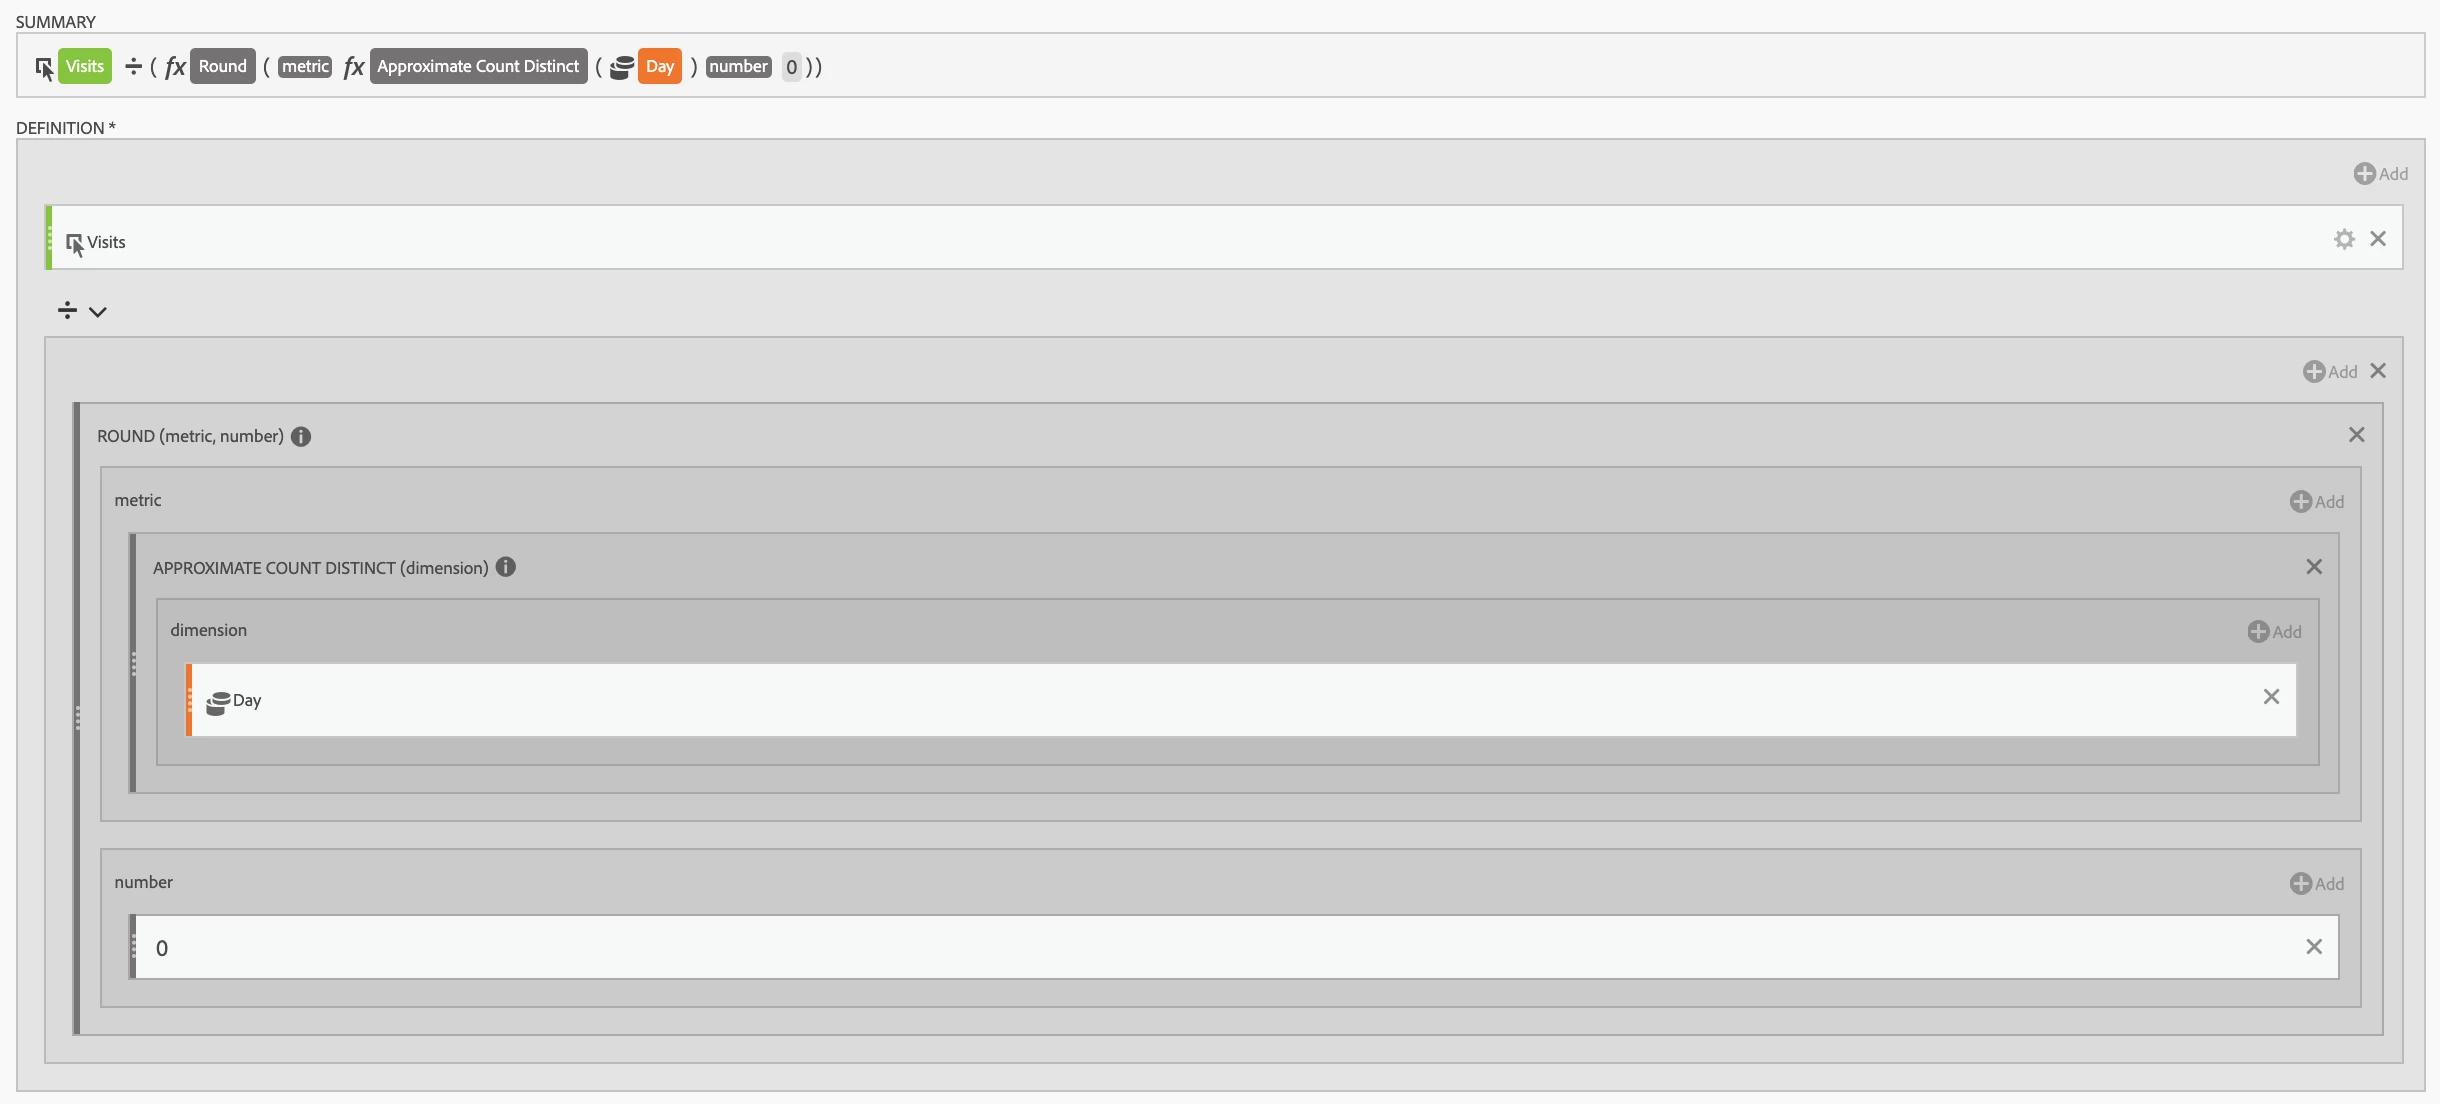
I am attempting to build a calculated metric to provide the average (mean) number of page views over a time period. Tried using the Mean function which seems to work in preview but is incorrect in a Metrics reportlet. Here is my calculation:
List Builder Segment (Mean ( metric Page View Summary include zeros true) ) )
Additional attempts to construct a metric and use it as a denominator have also failed.
Function Count (Calendar Day (v16) Instances)
AND
Segment List Builder (Page View Summary (Count(Page View Summary) ) )
Again, in the preview panel it seems to count the number of days or calculate an appropriate result but whne the metric is inserted in the Site Metrics Reportlet the results is not calculated as expected.
Thanks!
Tom