Solved
Bug? - Line Diagram by Week, Data range last full 53 weeks
Hi there,
I am working on create line chart for a specific ratio data. (please ignore the typos in the screen cuts)
Date range: last 53 full weeks.
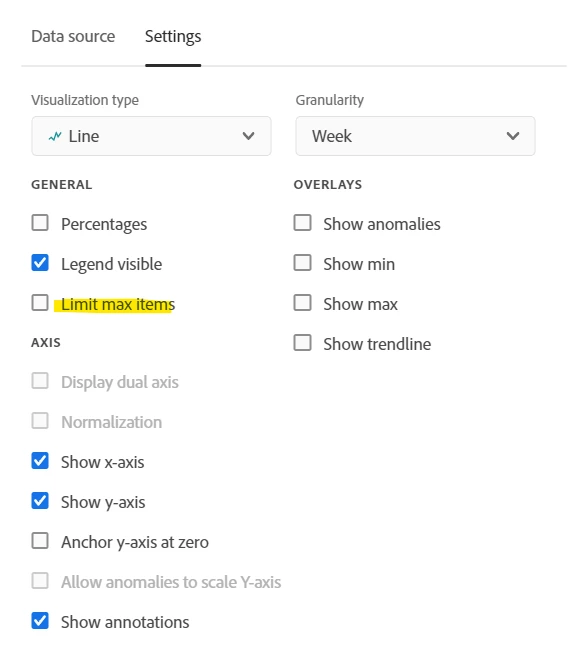
I select one cell and locked the selection for the chart on the upper-left, then choose granularity to "Month". - Until now there is no problem.
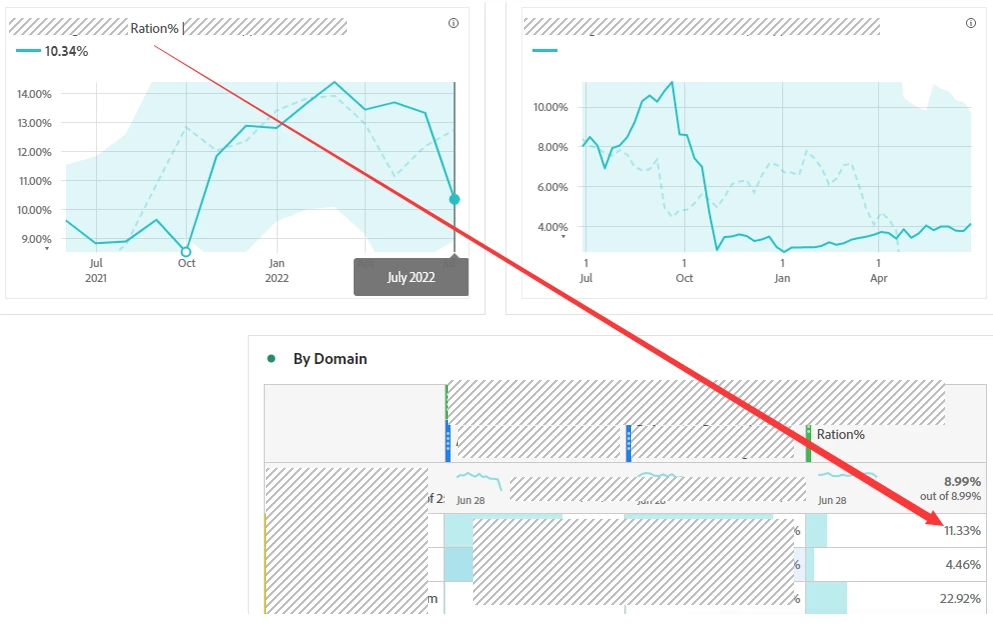
Then, on the upper-left chart, I change the Granularity from Month to Week, as you can see, the latest date can only till to some week of 2021, but not the latest week of end of June 2022 (now is early of July, not full week yet)
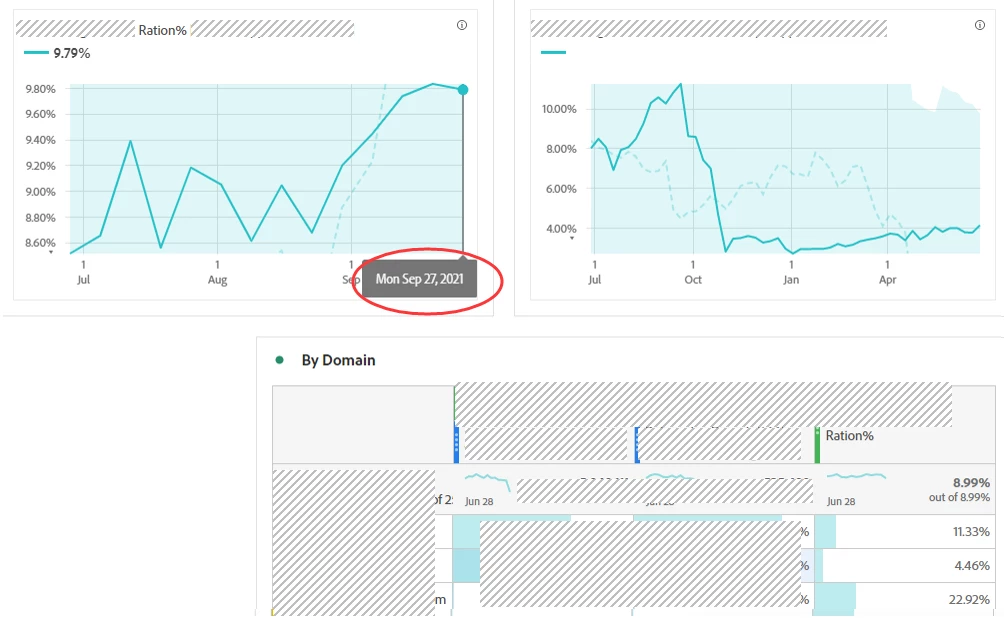
When I expand the chart to largest width, it works fine - the week of 27-JUN-2022 displayes.
Is it a bug caused by the too small size of line chart?
Is there a workaround to resolve?
Thank you.
H