Average visits per hour of day | Community
Skip to main content
April 16, 2021
Solved

Average visits per hour of day

  • April 16, 2021
  • 4 replies
  • 5924 views

Hi, I'm trying to calculate the average number of visits per hour of day over a given time period.
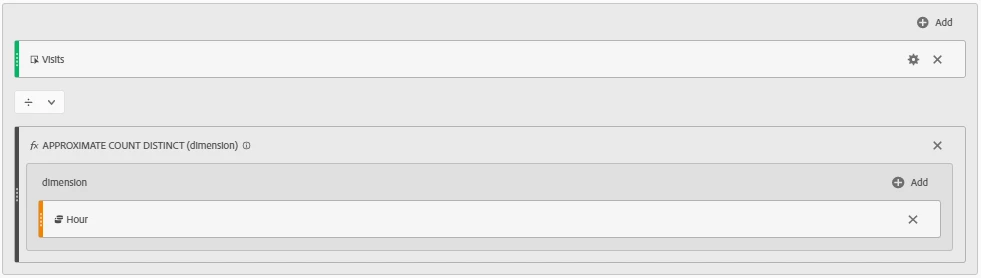
When I create an Average Visits metric like this: 

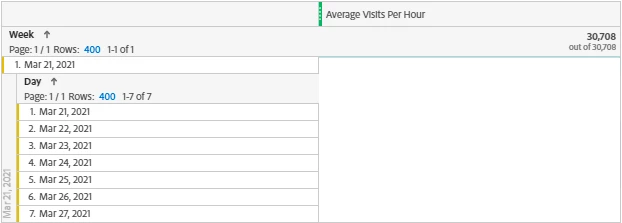
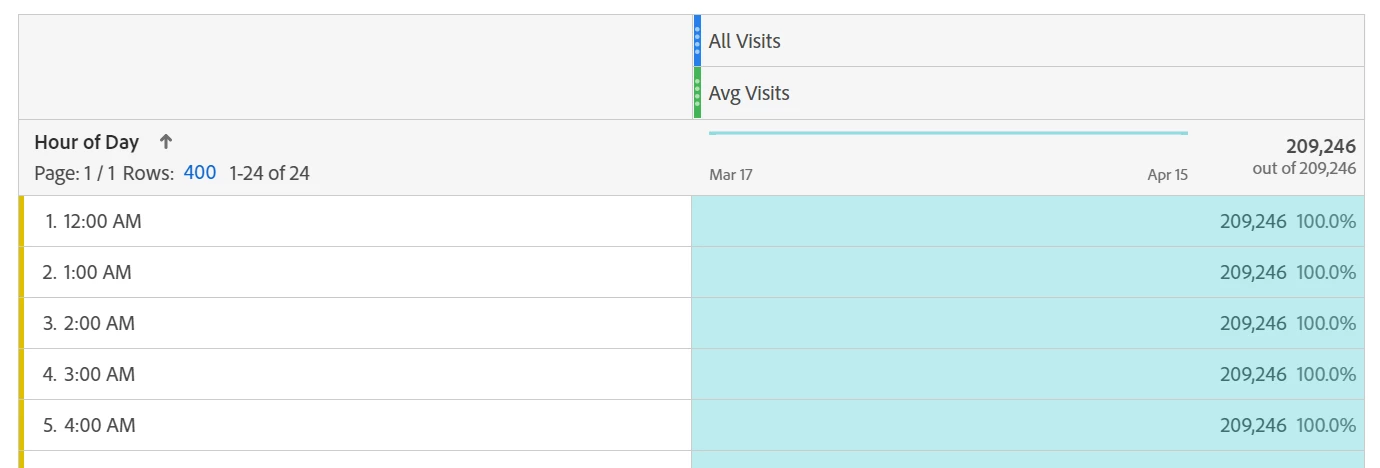
and then use that to breakdown by the Hour of Day dimension, I would expect it to give me the average per hour of day, however, it gives me only one value: the average of the entire selected time period. Like this:

How do i get the average number of visits that I can break down by hour of day?

This post is no longer active and is closed to new replies. Need help? Start a new post to ask your question.
Best answer by PratheepArunRaj

Dear mdep,

Are you looking for the average hourly visits in a day i.e. Visits in a day / 24? Or average hourly visits for the time period selected i.e. Visits for the time period / No. of hours for the time period? If yes, create a calculated metric based on the below.

Once created, you should see the below numbers.

But, not sure about the metric average number of visits per hour of the day, can you explain more?

Thank You, Pratheep Arun Raj B | Xerago | Terryn Winter Analytics

4 replies

yuhuisg
Community Advisor
Community Advisor
April 19, 2021

---

PratheepArunRaj
Community Advisor and Adobe Champion
PratheepArunRajCommunity Advisor and Adobe ChampionAccepted solution
Community Advisor and Adobe Champion
April 21, 2021

Dear mdep,

Are you looking for the average hourly visits in a day i.e. Visits in a day / 24? Or average hourly visits for the time period selected i.e. Visits for the time period / No. of hours for the time period? If yes, create a calculated metric based on the below.

Once created, you should see the below numbers.

But, not sure about the metric average number of visits per hour of the day, can you explain more?

Thank You, Pratheep Arun Raj B | Xerago | Terryn Winter Analytics

Thank You, Pratheep Arun Raj B (Arun) | Xerago | Terryn Winter Analytics
ManonDPAuthor
April 24, 2021

Hi Pratheep,

Thank you for your response.
Here's what I'm after: I'm trying to find out the most popular hour to visit the site on average. Instead of just summing visits per hour I want to take the average. 
Like this:

Date1AM2AM3AM4AM5AM6AM7AM
4/1/2021212461020
4/2/2021400541122
4/3/2021113561219
Average2.30.71.74.75.311.020.3

This is just and example, I'd need this for all hours of day (12AM to 12PM) for a certain date range.

So from this I can see that between 1 to 7AM we have on average most number of visits at 7AM.

Any chance you know how to do this in Adobe Analytics?
Thank you for your help!
Manon

Level 2
April 25, 2021

@manondp 

Hoping this should solve the problem without creating any additional metrics. Where the Bars are showing the maximum visits in a particular hour from Jan-Feb in this case. Make sure to update the Date range or feel free to use the Rolling date range.


May 22, 2023

Hi @pratheeparunraj 


I have created a calulated metric for Hour of Day But the numbers does not matches to the exact avg . Is this expected?
For example: for 1AM total visits for 40 days is 14717 (avg: 367 ) but the calculated metrics shows 364


Thanks

PratheepArunRaj
Community Advisor and Adobe Champion
May 24, 2023

Dear @vijayy ,

I doubt it will show the exact average and it is expected because we are using 'APPROXIMATE DISTINCT COUNT' for the dimension.

Thank You, Pratheep Arun Raj B (Arun) | NextRow Digital | Terryn Winter Analytics

Thank You, Pratheep Arun Raj B (Arun) | Xerago | Terryn Winter Analytics