
Tuesday Tech Bytes - Customer Journey Analytics - Week 3 - Best Practices
Over the last two weeks, we have looked at CJA Golden Nuggets and Tips & Tricks. Today we will look at best practices in CJA that can help your team work more effectively.
Data friendliness
The best practices we will explore today generally fall under the umbrella of things that make data easier to work with and understand. Making data easier to work with in CJA increases the efficiency and accuracy of analysts and other users. Adapting certain best practices also makes it easier for your audience to digest and understand the data.
Approved Components & Tags
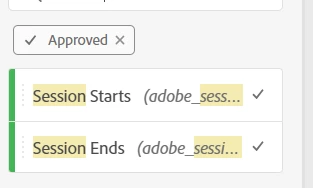
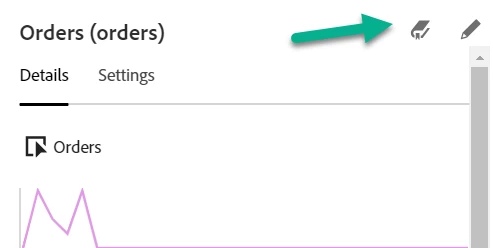
For components that are frequently used and have been well vetted, admins can mark those components as approved. Doing so adds a checkmark to the component.
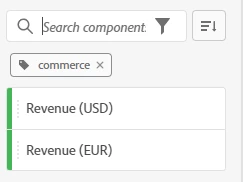
Additionally, adding tags to components can simplify the process of finding the correct component. Depending upon your use cases, you might tag components in categories such as geo dimensions, experimentation, funnel, and commerce. Adobe also provides OOTB tags such as dimensions, metrics, filters, and date ranges.
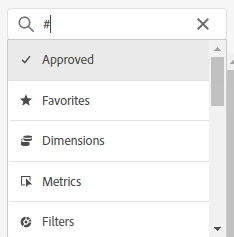
When users understand the meaning of these labels, efficiency and accuracy can be increased. Searching for approved components and other tags is as easy as typing # in the component search.
Component naming and description consistency
Another key best practice is ensuring that components are named consistently and have helpful descriptions.
I typically recommend using brief component names and teaching users how to access the details in the component information screen. We will view that in more detail below.
I would prefer to use component names such as campaign and internal campaign ID. In instances where there’s multiple components with differing persistence or deduplication, I suggest noting this as needed in the name. For example, first touch campaign | 30-day, last touch campaign | session, or start checkout | session deduplicated.
In setting up your schema, it is wise to have detailed descriptions for all components. These will feed into the connection and downstream into each data view. When there are differences needed for certain scenarios, these can be updated at the data view level.
When analysts and other users know they have consistent dimension names and clear descriptions, they self-serve more effectively.
Teaching users to leverage data dictionary & component information
Helpful information is available directly within CJA. (Traditional Analytics also provides some, but not all this information.)
The Data Dictionary provides a wealth of information about various components. There are multiple ways to get to the Data Dictionary.
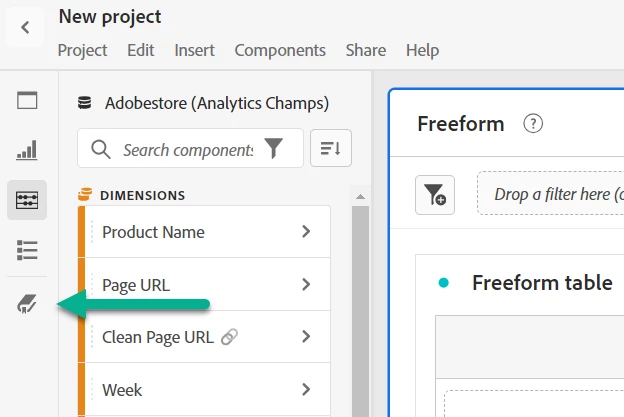
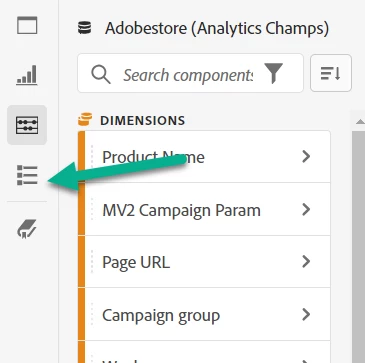
From Workspace, you can click on the bottom icon in the left rail.
While working with a component, you can click on the information icon and then the Data Dictionary icon.
Once in the Data Dictionary, you will see information about the selected component.
Admins can add specific components to the Frequently Used With... and Similar To... sections. These can help newer analysts dig deeper into insights. For example, including channel details as frequently used with marketing channels can be helpful. Excluding tracking code/campaign from appearing can also help user avoid common errors since those dimensions at differing scopes.
More information about the data dictionary is available in Adobe’s documentation.
While in Workspace, clicking on the information icon for a component will bring up detailed information. This icon is available in a project or while searching.
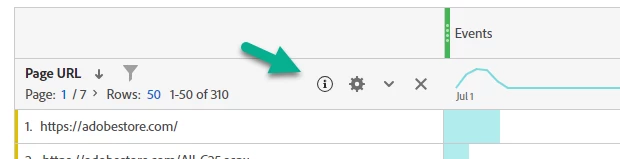
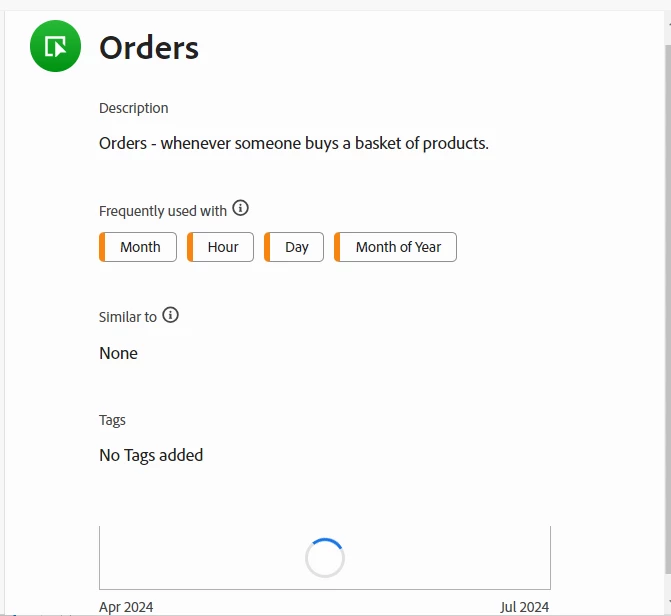
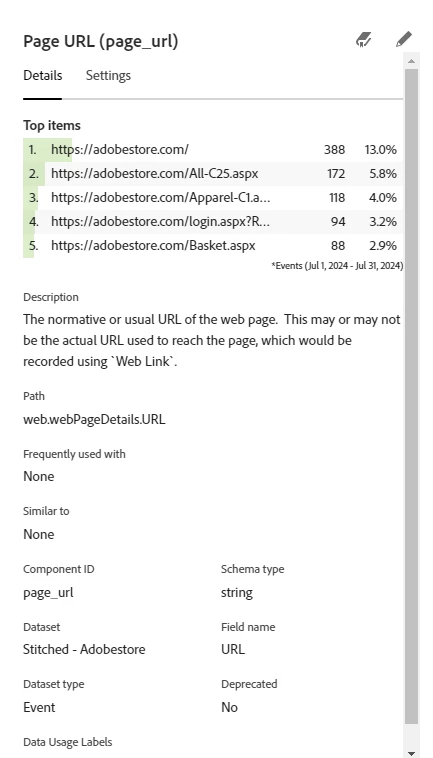
Clicking on this icon displays the details tab. Here you will find a variety of helpful information.
|
Top Items |
Top five recent values in the current data view |
|
Description |
A description of the component |
|
Path |
The schema path for the field |
|
Frequently Used With |
May display components that are frequently used with the displayed component |
|
Similar To |
May display components that are like the displayed component |
|
Component ID |
The unique ID for each component (used by APIs, BI Extension, etc.) |
|
Schema Type |
Displays the data type of the component (string, integer, date time, etc.) |
|
Dataset |
Shows the dataset(s) where the field is found |
|
Field Name |
Shows the field name in the dataset(s) |
|
Dataset Type |
Indicates the type of the dataset (event, lookup, profile) |
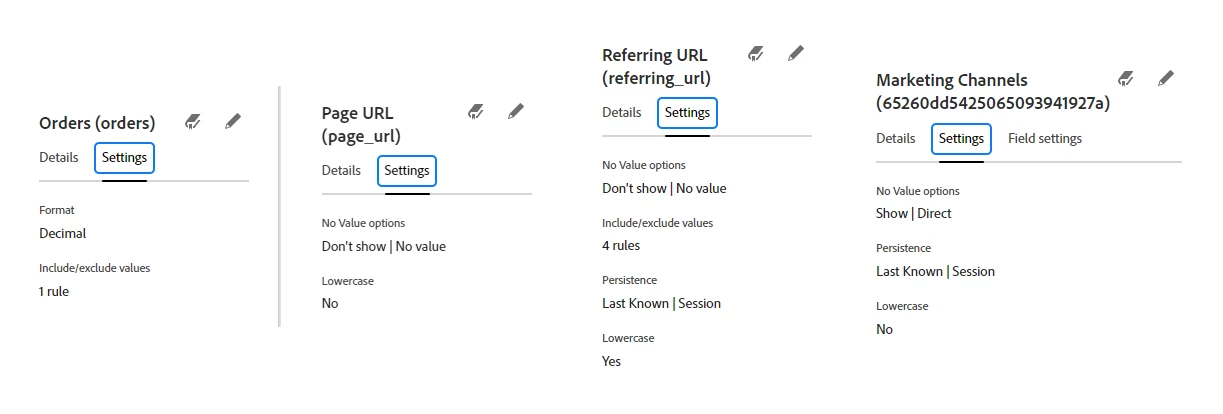
Clicking on settings will show additional details. Not all settings are present on all components.
|
No Value Options |
Shows the options for rows without a value for the current dimension. Show/Do not Show by default. “No value” is the default description. An administrator can change this. |
|
Lowercase |
Yes/No - indicates if the dimension is forced to all lowercase. Dimensions are case sensitive. For example: Homepage, homepage, and HomePage would all be reported separately. If lowercase is enabled, all of these would be reported together as homepage. |
|
Persistence |
When set, will show: Attribution - original (first), most recent (last), first know (applies the first known value to all hits), lats known (applies the last known value to all hits) Expiration - When persistence expires. Examples: Most recent | Session, Original | 90 Days, Original | Expire on: Order |
|
Behavior |
For metrics based on fields that are numeric: Count values - increments the metric by the value of the field (ex: revenue) Count instances - increments the metric by one (ex: order count) |
Starter Workspace Projects
Building best practice starter workspace projects can be useful for newer CJA users. Building out tables and visualizations can give users a solid foundation on which to begin building their own analysis. Adding these starters to the Company Folder (or a subfolder) can make them easy to find. All users have edit copy access to projects within the Company Folder.
Consistent user settings
Workspace provides the ability for users to save their default preferences. As a best practice, teams should determine which preferences are most effective for their use cases and audience. Individual users should then set their preferences in accordance with the team’s alignment.
These settings can be overridden in Workspace as needed based on the use case.
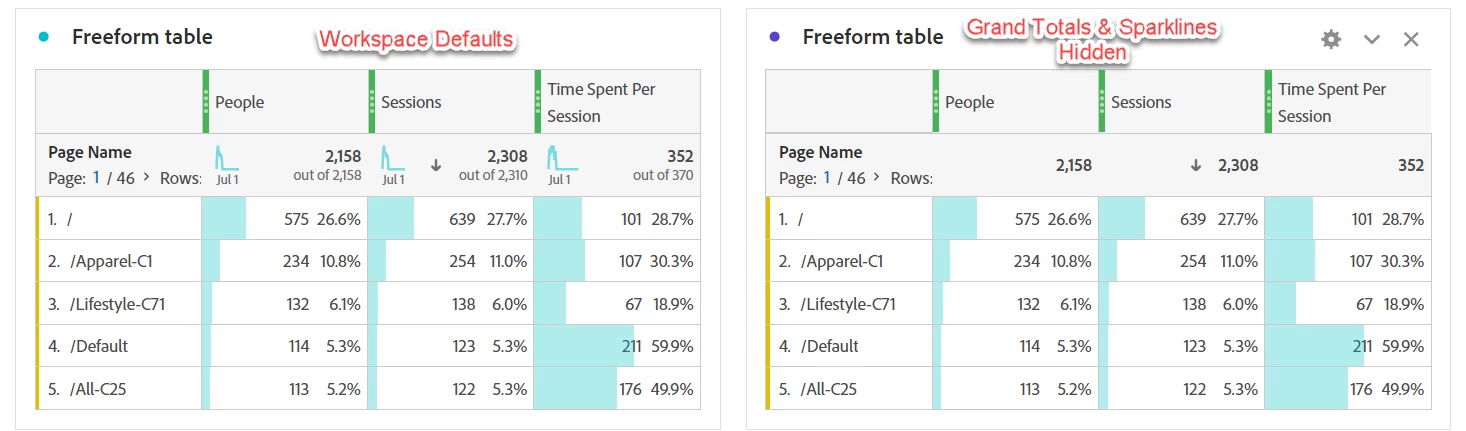
For example, by default Workspace displays Grand Totals and Sparklines. Teams may determine that hiding these is typically preferred.
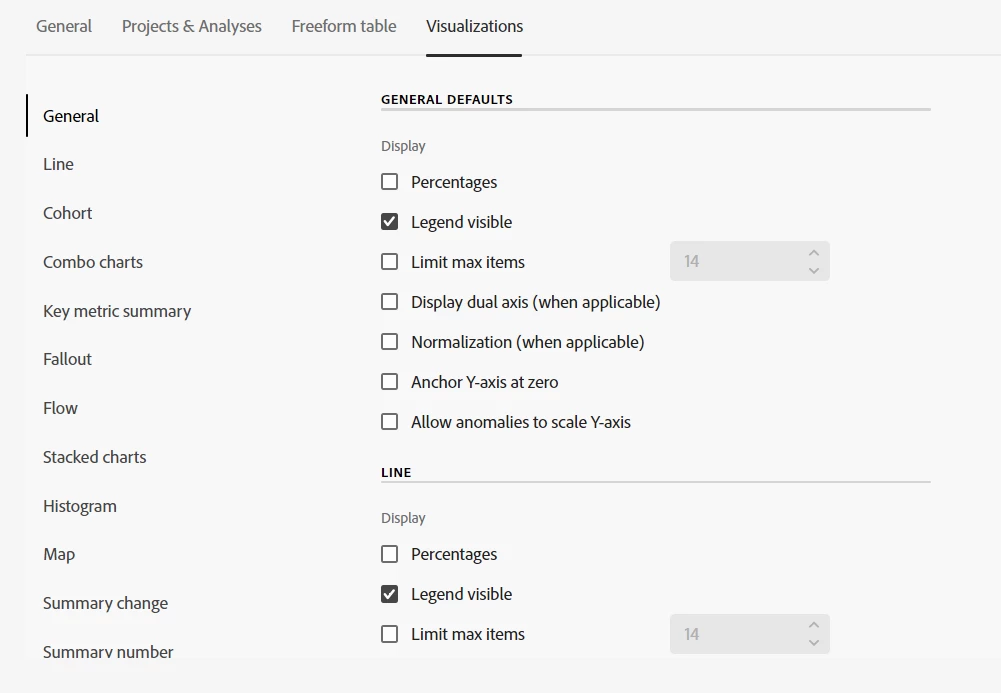
To update user settings, click Edit Preferences from the Projects landing page. Several categories of preferences are available.
Instead of events, you can select sessions or people as your default freeform table metric. You can also select other default breakouts such as week, month, countries, or regions. Each specific chart type also has defaults that can be selected, or you can choose global defaults. Limiting to a specific number of items and anchoring the y-axis at 0 are just a couple of the available options.
Aligning these best practices and creating consistency among the analytics team can provide a consistent experience for your audience.
Full details can be found in Adobe’s documentation.
Project table of contents
A table of contents can increase the effectiveness of a Workspace project. CJA creates an automatic table of contents for each project. To open, click the Table of Contents icon on the left rail as shown below.
After clicking the icon, a table of contents for the current project will be displayed. Panel names are the top level, while table/visualization names are nested. Clicking will take the user to the selected item.
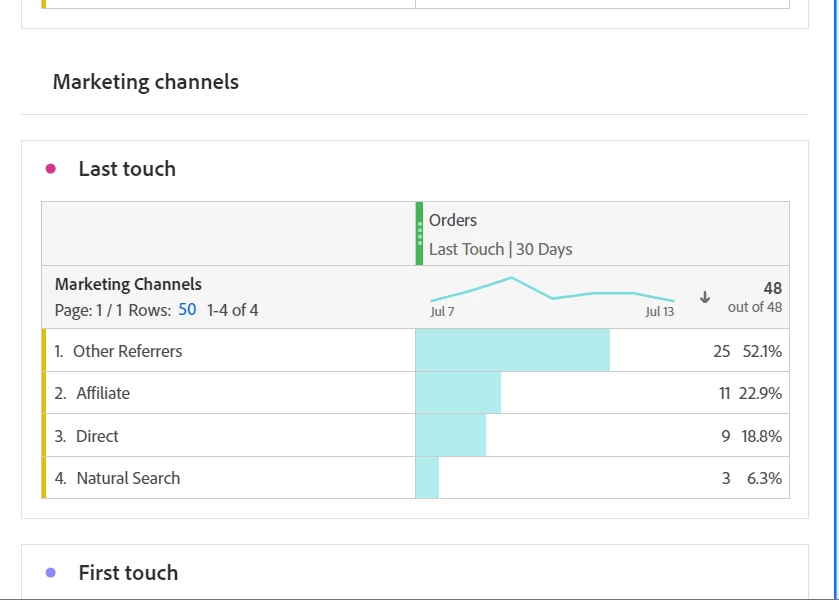
There is also a new Section Header “visualization type.” Adding this can help create dividers in your project as shown below with the “Marketing channels” header.
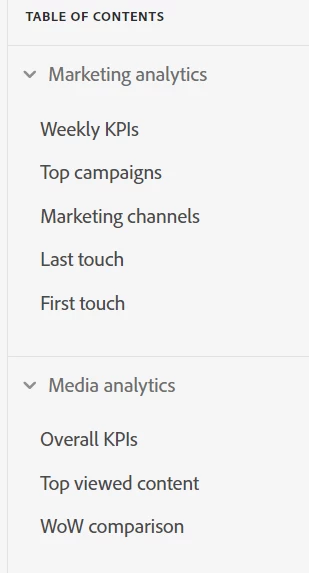
Although the table of contents lists the header at the same level as tables and visualizations, it would be a helpful future enhancement to allow the ability to have a nested table of contents.
For additional information, see Adobe’s documentation.
What are some of the best practices you’d like to share with others? Comment below and share!