Summarize column of calculated fields
- Mark as New
- Follow
- Mute
- Subscribe to RSS Feed
- Permalink
- Report
I have a report that is pulling a column for a calculated field that we use on a custom form and am trying to figure out how to summarize it (by SUM) so that it shows the total at the grouping level.
Is there text mode that can accomplish this?
Solved! Go to Solution.
Views
Replies
Total Likes
![]()
- Mark as New
- Follow
- Mute
- Subscribe to RSS Feed
- Permalink
- Report
Hi Kasey,
The better approach is definitely to get the data format right. This will enable you to great graphs/charts from the data in the future should you need to.
If however, you can't change the format (since you can't amend once the field is created and making a new field might be problematic), you could use the following text mode for the column in your report:
aggregator.displayformat=HTML
aggregator.function=SUM
aggregator.valueexpression=NUMBER({DE:FIELD NAME})
aggregator.valueformat=HTML
displayname=
linkedname=direct
namekey=FIELD NAME
querysort=DE:FIELD NAME
textmode=true
valueexpression=NUMBER({DE:FIELD NAME})
valuefield=FIELD NAME
valueformat=customDataLabelsAsString
This should SUM all of the values into your group header.
Best Regards,
Rich.

![]()
- Mark as New
- Follow
- Mute
- Subscribe to RSS Feed
- Permalink
- Report
Hi Kasey,
As long as your calculated field is in a number format, you should have the ability to summarise that column by SUM from within the report builder, without any need for text mode. Simply click on that column when configuring your view, and there is a drop-down menu where you can choose how you want to summarise that column
Best Regards,
Rich

Views
Replies
Total Likes
- Mark as New
- Follow
- Mute
- Subscribe to RSS Feed
- Permalink
- Report
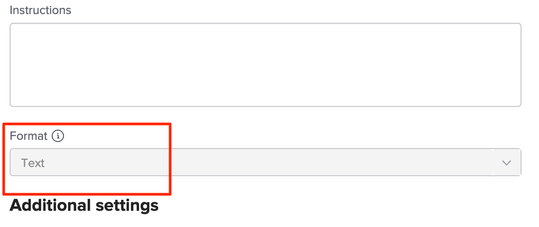
Thank you!! I don't have that option at the moment - but when looking into my calculated field on the form it's set to "text" format rather than "number" but does not allow me to change it.. which must be the issue... I will look into how I can fix this! I appreciate your help
Views
Replies
Total Likes
![]()
- Mark as New
- Follow
- Mute
- Subscribe to RSS Feed
- Permalink
- Report
Hi Kasey,
The better approach is definitely to get the data format right. This will enable you to great graphs/charts from the data in the future should you need to.
If however, you can't change the format (since you can't amend once the field is created and making a new field might be problematic), you could use the following text mode for the column in your report:
aggregator.displayformat=HTML
aggregator.function=SUM
aggregator.valueexpression=NUMBER({DE:FIELD NAME})
aggregator.valueformat=HTML
displayname=
linkedname=direct
namekey=FIELD NAME
querysort=DE:FIELD NAME
textmode=true
valueexpression=NUMBER({DE:FIELD NAME})
valuefield=FIELD NAME
valueformat=customDataLabelsAsString
This should SUM all of the values into your group header.
Best Regards,
Rich.

- Mark as New
- Follow
- Mute
- Subscribe to RSS Feed
- Permalink
- Report
You are a life saver! That worked perfectly. Thanks so much!
Views
Replies
Total Likes
Views
Likes
Replies


