Solved
Create Chart/Report for Average Requests Completed by Resource by Week and Month
How would I create a chart/report with the average requests completed by resource (Assigned To) by week and month?
How would I create a chart/report with the average requests completed by resource (Assigned To) by week and month?
Hi David, sorry I didn't see this the first time!
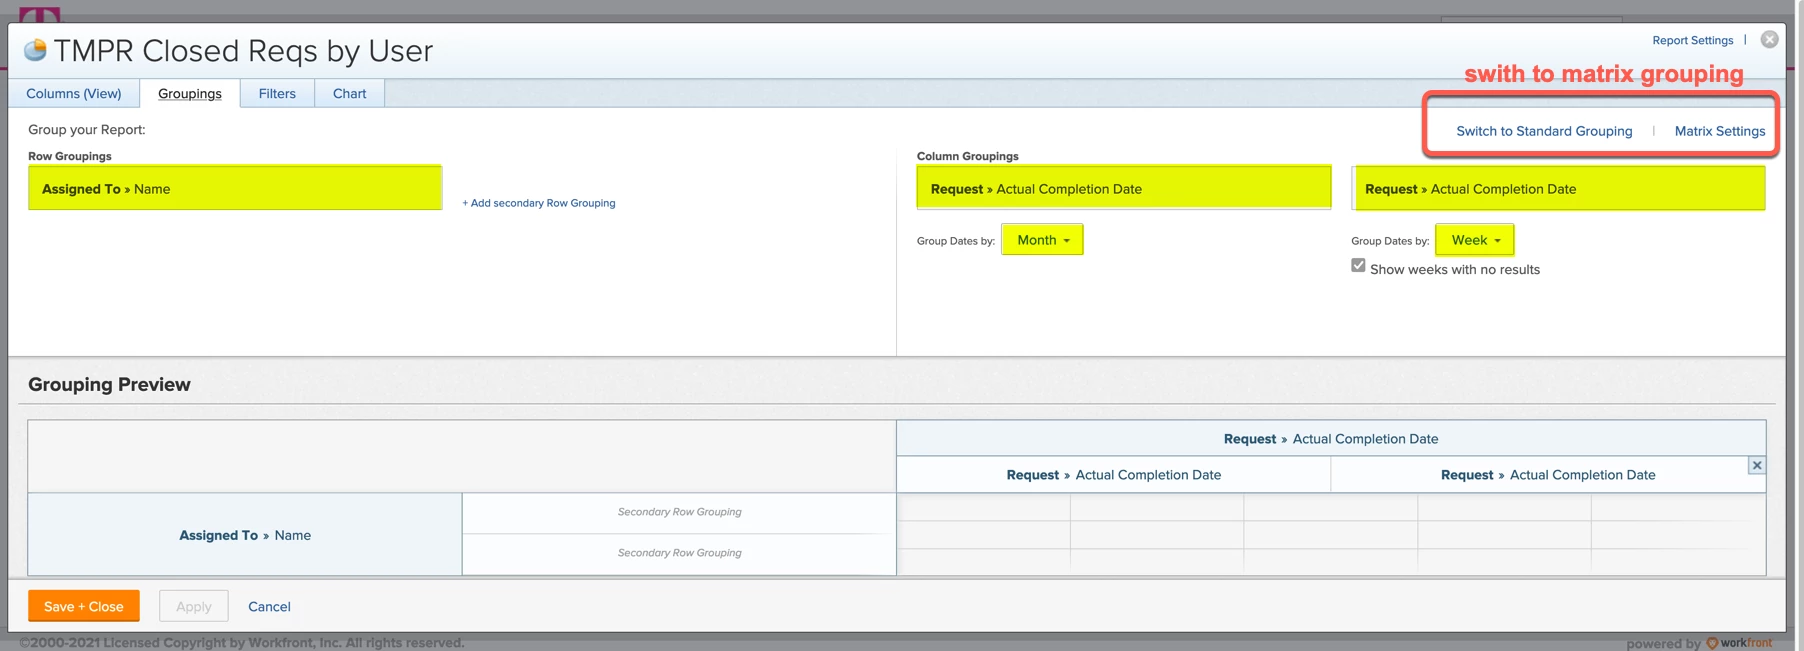
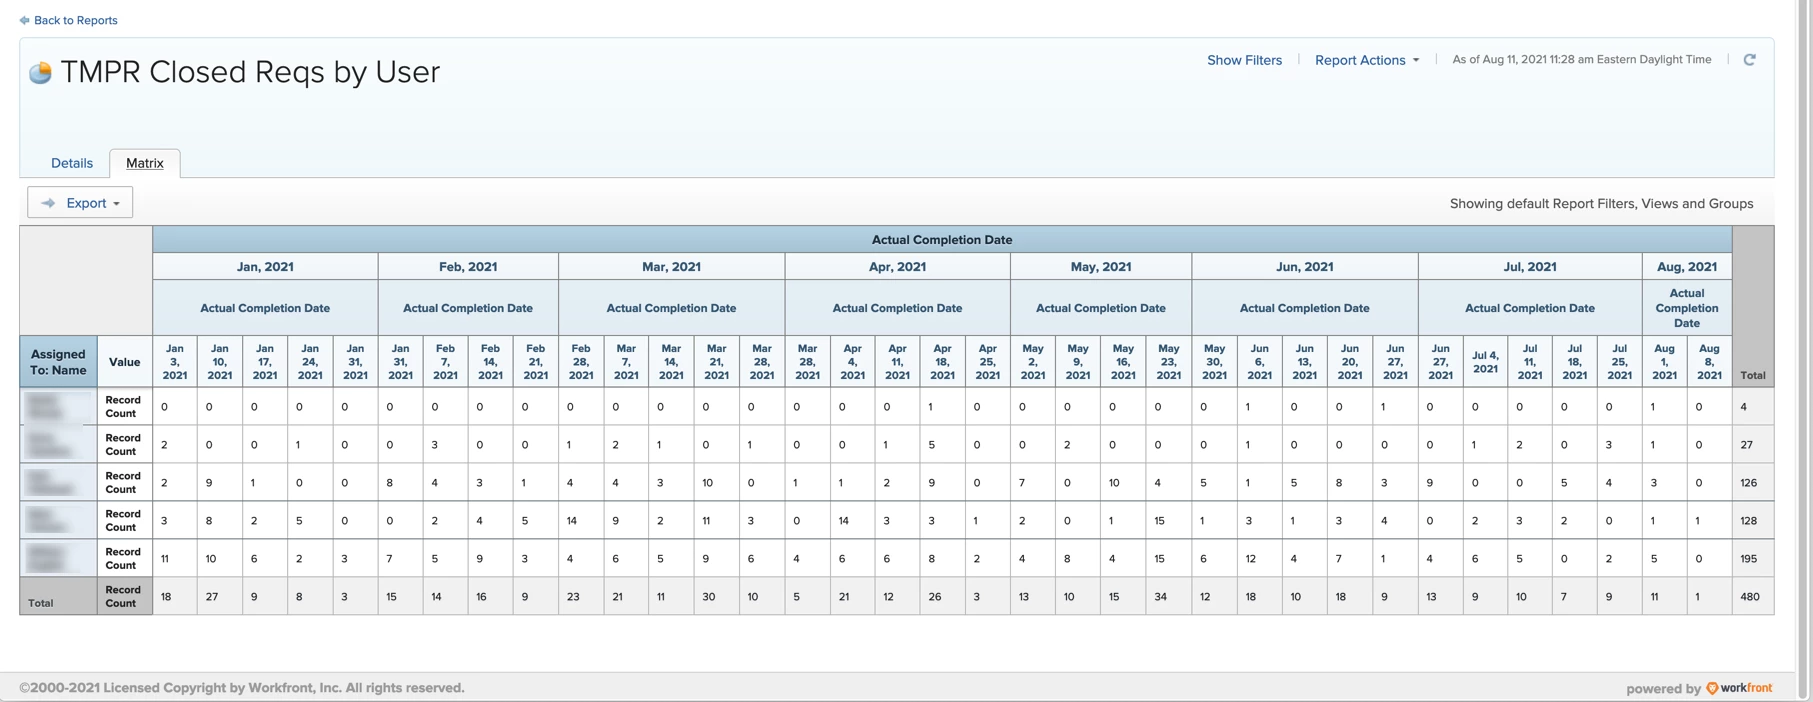
I think you want a matrix report. In your request report, switch to matrix grouping for a tabular view that shows record counts by month and week. You can export the matrix to Excel if you need to perform additional calculations.
In some cases (multiple users assigned to the same request, or wanting a combination of completed tasks and requests), you might consider doing this on an Assignment report instead of a Request report.
Enter your E-mail address. We'll send you an e-mail with instructions to reset your password.