Calculating the percentage of billable hours and then displaying that value beside the 'Total Hours' in a report.
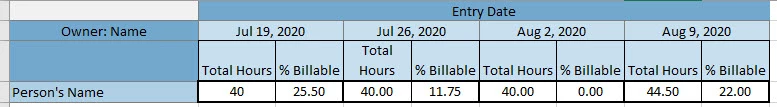
We're trying to come up with a report that displays two values per user per week over a four week span: total hours AND the percentage of those total hours that are considered "billable hours". Total hours is already there - my environment only has three types of hours (Project, Task, Timesheet). Our challenge is coming up with the percentage of billable hours. In this case, billable hours should be defined as Total Hours, minus the overhead hours (“Timesheet” type), minus hours logged to projects where the custom project form field “Billing Code” equals “#nonBillable”; divided by total hours to get the percentage. And then finally, once we get the calculation figured out; we want those values (Total Hours, % Billable) to appear side by side in a matrix view. I've attached a couple examples of what the report might look like in the end.
Full credit if we can just simply get the calculation and come up with a stand-alone report showing billable hours percentage. Extra credit and a rowdy applause if we can get everything in a single report as pictured.