Why do my event-based DTM rules result in no custom link data going to Adobe Analytics?
- Mark as New
- Follow
- Mute
- Subscribe to RSS Feed
- Permalink
- Report
I have a new Web Property and I added the Adobe Analytics tool via manual configuration. I'm fairly confident that the Adobe Analytics tool is correctly configured as I'm seeing data for Visitors and other basic stats in Adobe Analytics Reports.
I have created a couple of event-based rules in DTM.
The rules trigger in response to clicks on certain DOM elements. I have confirmed that the rules are triggering when expected by adding Javascript tags that make entires in the console.log().
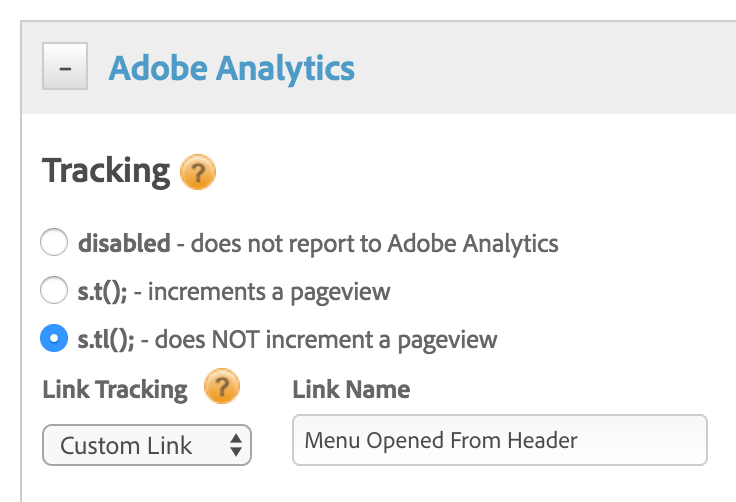
I have added this type of Adobe Analytics configuration to each rule:
Using Chrome dev tools Network tab, at the time the rules are triggered, I am not seeing the browser load anything. Furthermore, I'm not seeing any Custom Event data appear in Adobe Analytics Reports.
I've had a look at the logs in the global _satellite object created by DTM and I see only the expected messages about rules being triggered, but I don't see anything about Adobe Analytics.
Any ideas what might be wrong here or how I can further debug? Am I right to expect the browser to load something from my reporting server hostname? Any gotchas on configuration of the Adobe Analytics Tool to look out for? Or maybe I'm overlooking some required value in the Rule configuration?
Solved! Go to Solution.
- Mark as New
- Follow
- Mute
- Subscribe to RSS Feed
- Permalink
- Report
It turns out I had the 'eu cookies' flag set in the Adobe Analytics Tool configuration within DTM. This causes DTM to silently skip initialization of Adobe Analytics if the sat_track cookie is not set to a value of '1'. It would be helpful to console log this condition to make it more difficult to debug.
![]()
- Mark as New
- Follow
- Mute
- Subscribe to RSS Feed
- Permalink
- Report
I'd suggest installing the DTM switch plugin - Installing the Debugging Tools
Once you've got the switch installed, turn on the debug mode. Then you can reload your page with the console open. It will show you a lot more debug information. You should be be able to see if the rules are indeed firing.
If you'd like me to take a look, I'd be happy to. I just need the URL and the rule name.
Cheers,
Jantzen
Views
Replies
Total Likes
- Mark as New
- Follow
- Mute
- Subscribe to RSS Feed
- Permalink
- Report
Thanks for the advice!
I installed the plugin and it confirmed that my rules are firing, but the Network tag of the Chrome debug tools shows no requests being made to my configured tracking server domains. Any idea how to debug why this might be?
Views
Replies
Total Likes
- Mark as New
- Follow
- Mute
- Subscribe to RSS Feed
- Permalink
- Report
Also - app is pre-production so I can't share a URL with you. We could maybe screenshare, though, if you've got 15 minutes.
Views
Replies
Total Likes
![]()
- Mark as New
- Follow
- Mute
- Subscribe to RSS Feed
- Permalink
- Report
Interesting.... So the swtich is showing the rules are firing when set to debug, but your not seeing the Analytics beacons being fired?
Which debugger are you using to verify the image requests are not being sent? I typically use either the Observpoint chrome plug-in or the Adobe debugger.
Can you send screenshots of the console messages and the adobe debugger or Observpoint plug-in so I can see what if any requests are being generated?
If you would rather do a screen share, Client Care is the best option for that. They have the tools and access to set something up with you directly and troubleshoot as needed.
Views
Replies
Total Likes
- Mark as New
- Follow
- Mute
- Subscribe to RSS Feed
- Permalink
- Report
Here is console output from Observpoint plugin:
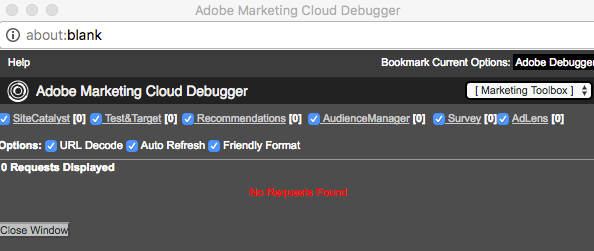
I confess that I find the Adobe Debug plugin a bit confusing and I've not been able to get it to generate any useful output. You are talking about this interface?
If so, any clues on how to get interesting data from it?
I am using the normal Network tab of the default Chrome debug tools to watch queries coming from the browser and I'm not seeing ANY going to my configured Adobe Analytics tracking servers.
Any ideas?
Views
Replies
Total Likes
![]()
- Mark as New
- Follow
- Mute
- Subscribe to RSS Feed
- Permalink
- Report
Just to clarify, you are looking at the staging library right? As of now when I look into the account I do not see the rules as being published to production yet.
Views
Replies
Total Likes
- Mark as New
- Follow
- Mute
- Subscribe to RSS Feed
- Permalink
- Report
Yes. I've confirmed by looking at the .js include and by using debug plugins that I'm using the staging library.
Views
Replies
Total Likes
![]()
- Mark as New
- Follow
- Mute
- Subscribe to RSS Feed
- Permalink
- Report
Let's back up a step here. Create a simple page load rule and set an evar to a test value. Let's make sure that Analytics car fire the beacon from your beta environment, and that we can see the beacon in a debugger of some flavor.
Views
Replies
Total Likes
- Mark as New
- Follow
- Mute
- Subscribe to RSS Feed
- Permalink
- Report
I disabled all rules and created a single new Page Load Rule that sets:
eVar1="1"
On page load, I see the staging .js lib get loaded from assets.adobedtm.com, but I don't see any calls from the browser to the tracking server. Further, the various debug tools do not report that DTM is loaded, much less any analytics-related data.
But...
On at least one page load, this was not the case. I saw the expected calls to the tracking server and debug rules indicated that DTM was loaded and Analytics was working as expected. And then I didn't see them again. I am thinking that we may have an intermittent issue here, possibly caused by some kind of timing issue in the page load. Is there a way to debug the DTM bootstrap process?
Views
Replies
Total Likes
![]()
- Mark as New
- Follow
- Mute
- Subscribe to RSS Feed
- Permalink
- Report
I'm not sure what to make of that. How do you have DTM deployed to the page? Have you placed the required embed tags in their correct locations? Are they statically loaded with the HTML or are they being injected by some framework?
Is there a chance you could deploy your DTM library on a test site that is hosted on your local machine? If not, would you mind providing your DTM company name so I can try on my side?
From the sound of it, I'd guess there is either something wrong with the implementation or your firewall may be blocking requests outside the network.
Views
Replies
Total Likes
- Mark as New
- Follow
- Mute
- Subscribe to RSS Feed
- Permalink
- Report
It turns out I had the 'eu cookies' flag set in the Adobe Analytics Tool configuration within DTM. This causes DTM to silently skip initialization of Adobe Analytics if the sat_track cookie is not set to a value of '1'. It would be helpful to console log this condition to make it more difficult to debug.
![]()
- Mark as New
- Follow
- Mute
- Subscribe to RSS Feed
- Permalink
- Report
Ah yes, sorry I didn't think to mention that. That flag isn't selected by default but I do agree, having a message in the console indicating the flag is on would be helpful. I'll be sure to mention it to the team.
Views
Replies
Total Likes
Views
Likes
Replies
Views
Likes
Replies


