Hi Team,
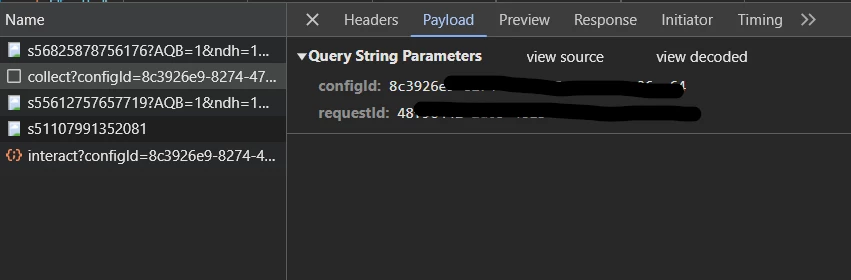
Why do I see some Web SDK collect calls triggering as ping type returning 204 status and these have no post body. I also don't see any initiator showing for these calls,
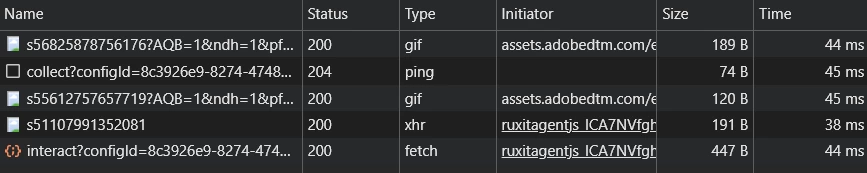
I'd like to understand couple of things,
What settings in Web SDK are triggering these calls?
What is the purpose of these calls? I don't see any post body so what information are they collecting and how?
Why are they sent as ping instead of xhr/fetch and why the have 204 status?
Thanks
Solved! Go to Solution.
Views
Replies
Total Likes
question: have you checked the calls with an open Assurance session? Maybe that gives more information.
We just had the same question in the newly created slack channel for community advisors.
Assumption is that it is the browser that - upon navigation - is not properly presenting the information whilst still sending it as expected.
When the click opens a new tab it seems to always be included, so probably a bug in the browser when it comes to presenting the data.
One suggestion: can you maybe print out the payload in the onBeforeEventSend callback in the WebSDK config and make sure to preserve the browser logs.
My assumption would be that if you see it in the console, it should also arrive on the Edge network.
_satellite.logger.debug(">>> Web SDK Call\n", JSON.stringify(content.xdm, null, 2));
I will keep you updated on the internal discussions.
when do you see the calls? Upon page load?
By any chance, do you have collect link clicks enabled?
Also, do you have any custom logic in the on before event send or click properties callback that might potentially modify the request data?
Hi @bjoern__koth ,
We have download links click tracking enabled but no logic to modify or drop the request payload. I expect atleast the standard fields like timestamp to be sent on these calls but they don't have any payload at all.
Not sure about what is the purpose of these calls and if these are calls for click tracking, how are the collecting the relevant information?
Thanks,
ok, but when are they triggered? alongside a download link click?
No we are seeing them trigger on links that navigate to other pages.
Would be a bit odd to have unnecessary calls alongside your regular clicks. Even if they return a 204
Have you checked if this might come from any browser extensions running?
@Harveer_SinghGi1 it seems to be a internal , configuration call to check the Edge config prior to loading/launch of any script.
in your case getting 204 this could be due to a null response which might be due to incomplete or zero config on the edge network- can you post a response here
question: have you checked the calls with an open Assurance session? Maybe that gives more information.
We just had the same question in the newly created slack channel for community advisors.
Assumption is that it is the browser that - upon navigation - is not properly presenting the information whilst still sending it as expected.
When the click opens a new tab it seems to always be included, so probably a bug in the browser when it comes to presenting the data.
One suggestion: can you maybe print out the payload in the onBeforeEventSend callback in the WebSDK config and make sure to preserve the browser logs.
My assumption would be that if you see it in the console, it should also arrive on the Edge network.
_satellite.logger.debug(">>> Web SDK Call\n", JSON.stringify(content.xdm, null, 2));
I will keep you updated on the internal discussions.
Hi @bjoern__koth ,
Thanks for checking on this. I'll do some more testing using assurance and onBeforeSendEvent as suggested and share the findings here.
Thanks.
Views
Replies
Total Likes
Hi @bjoern__koth ,
I did some testing and it indeed looks like a timings issue as document unloads before the call could get completed, the client side calls don't show up anything but edge logs show data in the call,
Browser debugger client side logs: collect calls shows in network without any post body followed by a proper page load call of next page, notice the XDM print in onBeforeSendEvent doesn't print anything for the collect call but it does for the page load call,
AEP debugger client side logs: they also match with browser debugger logs,
Edge logs: these show proper XDM payload associated with the request id for collect call,
Also, when I try CTRL+Click (opening that link in new browser tab) on the same link, it has all the payload similar to what was shown in edge logs for above call,
So, it looks like it's just front end rendering issue caused due to timing but the data is actually collected correctly.
Cheers!
Thanks for the extensive testing, @Harveer_SinghGi1
It always has been and still is a pain to analyze pings in the browser. Don't know if it's more of a Chrome issue, but yes, it is annoying.
Views
Like
Replies