Understanding the Root Causes Driving Conversion with Superpowered Enhancements to Adobe Analytics
Authors: Eric Matisoff and Jody Arthur

Learn about two new, superpowered enhancements that Adobe Analytics is bringing to attribution. With Algorithmic Attribution now available within Adobe Analytics, practitioners can use machine learning to gain deeper insights faster than ever. Custom Lookback Windows ensure analysts identify the full set of touchpoints that result in a conversion. With their powers combined, Adobe customers will identify insights faster than ever in order to more accurately segment and activate using Adobe Experience Platform and other marketing tools.
This post introduces two new enhancements to Adobe Analytics that extend the already powerful Attribution IQ capabilities in Adobe Analytics. At Adobe, we feel it is imperative to expand on our fully flexible attribution features to ensure customers are able to analyze at the speed of thought — answering questions as quickly as they arise.
The first enhancement, for Adobe Analytics Ultimate customers, adds Algorithmic Attribution to our already powerful rules-based attribution models in Adobe Analytics. Within Analytics you have had the ability to apply your own rules-based models for years. For example, with a rules-based attribution model, you might assign 50% to the most recent touch, 20% to the first touch, and the remaining 30% across all the other, assisting interactions that a customer has with your brand. However, figuring out which exact model and weights to apply to your metrics and dimensions requires a significant amount of work comparing and contrasting different models.
Now, with Algorithmic Attribution, you can instead use machine learning to get your answers, essentially giving you the “Cliffs Notes” of attribution. In the same way, Cliffs Notes synthesize 2,000 pages of a book into 50 pages, machine learning can take enormous amounts of data and give you the answers you need in far less time than it would take to develop an effective rules-based attribution model.
Algorithmic Attribution is an Adobe Sensei feature accessible within Adobe Analytics and uses statistical techniques to allocate different weights to the different dimension values in your report. This feature is based on two models, the Shapley model (Shapley, 1953) and the Harsanyi Dividend (Harsanyi, 1963).
This post will show you how to access the new Algorithmic Attribution feature in Adobe Analytics. But first, we want to also introduce another new and powerful enhancement for Adobe Analytics that supports both Algorithmic Attribution and every other type of rules-based attribution model that Analytics provides. This new feature is called Custom Lookback Windows.
Prior to the release of Custom Lookback Windows, attribution credit is limited to either the beginning of the visit the visitor’s data within the month’s reporting time period being analyzed. For example, if you want to identify the key marketing touchpoints that drove the cars that were sold in March, you would set March as your reporting time period and consider changing your attribution model from the last touch to linear or a custom model. This simple change in Analysis Workspace would show you all the March marketing touchpoints associated with March car purchases. However, this would ignore any marketing touchpoints that occurred in February or earlier. This is what the Custom Lookback Window provides. With this new feature, you can still use March as the timeframe for your sales data, but you can now set your lookback window to go back farther, maybe 3–4 months, in this case, to understand all the touchpoints that led up to that customer making the purchase.
The especially impressive part of this new feature is how Analytics attributes the associated touchpoints for each conversion. Continuing our example where we are analyzing the marketing touchpoints that drove car purchases in March, if a customer were to purchase a car on March 31st, then the Custom Lookback Window set to 3 months will go back to December 31st to identify the touchpoints. In that same Workspace project, another customer may have purchased a car on March 1st. For that customer, the 3-month lookback window would go back to December 1st to identify the associated touchpoints. This may seem like a subtle difference, but it’s incredibly important to us to ensure the complete set of data is included in your analyses. The ability to now customize and go farther back in time based on your business needs and sales cycle provides a far more robust picture of the different marketing channels that drive conversion.
Custom Lookback Windows can be applied to both rules-based attribution models as well as Algorithmic Attribution. Both of these new enhancements — Algorithmic Attribution and Custom Lookback Windows — complement each other well and together add many new tools to your Analysis Workspace toolbox (Figure 1). The more robust insights derived in Adobe Analytics can also enhance the opportunity for action. These insights improve your ability to segment and activate in Adobe Experience Platform to deliver more personalized experiences through Real-time Customer Data Platform.
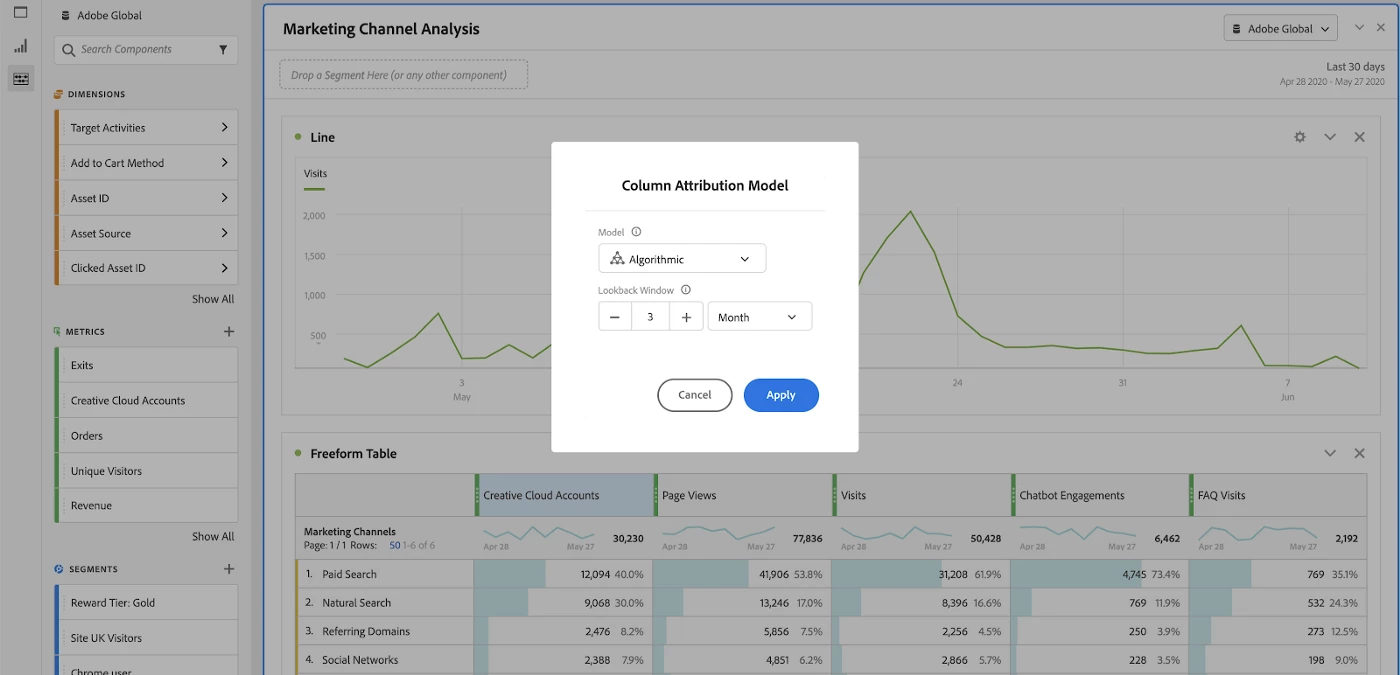
Where you can find these new features within Adobe Analytics
The attribution feature set within Adobe Analytics is called Attribution IQ. One of the most significant benefits of Attribution IQ is that it can be applied to virtually any metric in Adobe Analytics and therefore any dimension, allowing you to go much broader than just analyzing purchases by marketing channel. For example, you can look at registrations per internal search term. Say someone is searching your site for account, and then they search for login, then registration, and then they finally register. You can determine which of those search terms or combinations of search terms deserves credit for that registration simply by adjusting your attribution model. Adobe Analytics will help you determine which model provides the closest fit to the experience your business delivers. And now, you have the additional option to use Algorithmic Attribution.
You can find both Algorithmic Attribution and Custom Lookback Windows in the same three places in Analysis Workspace that you are already used to using when applying Attribution IQ:
Using attribution in freeform tables
In Analysis Workspace, the attribution model can be adjusted by clicking the gear next to your metric’s column header, and finding the Data Settings region (blue box in Figure 2). Then, select the checkbox to Use non-default attribution model. Then in the dropdown menu that opens for the attribution model, you can choose any attribution model, including the new Algorithmic Attribution model (red box in Figure 2). Finally, you can select your Custom Lookback Window (green box in Figure 2).
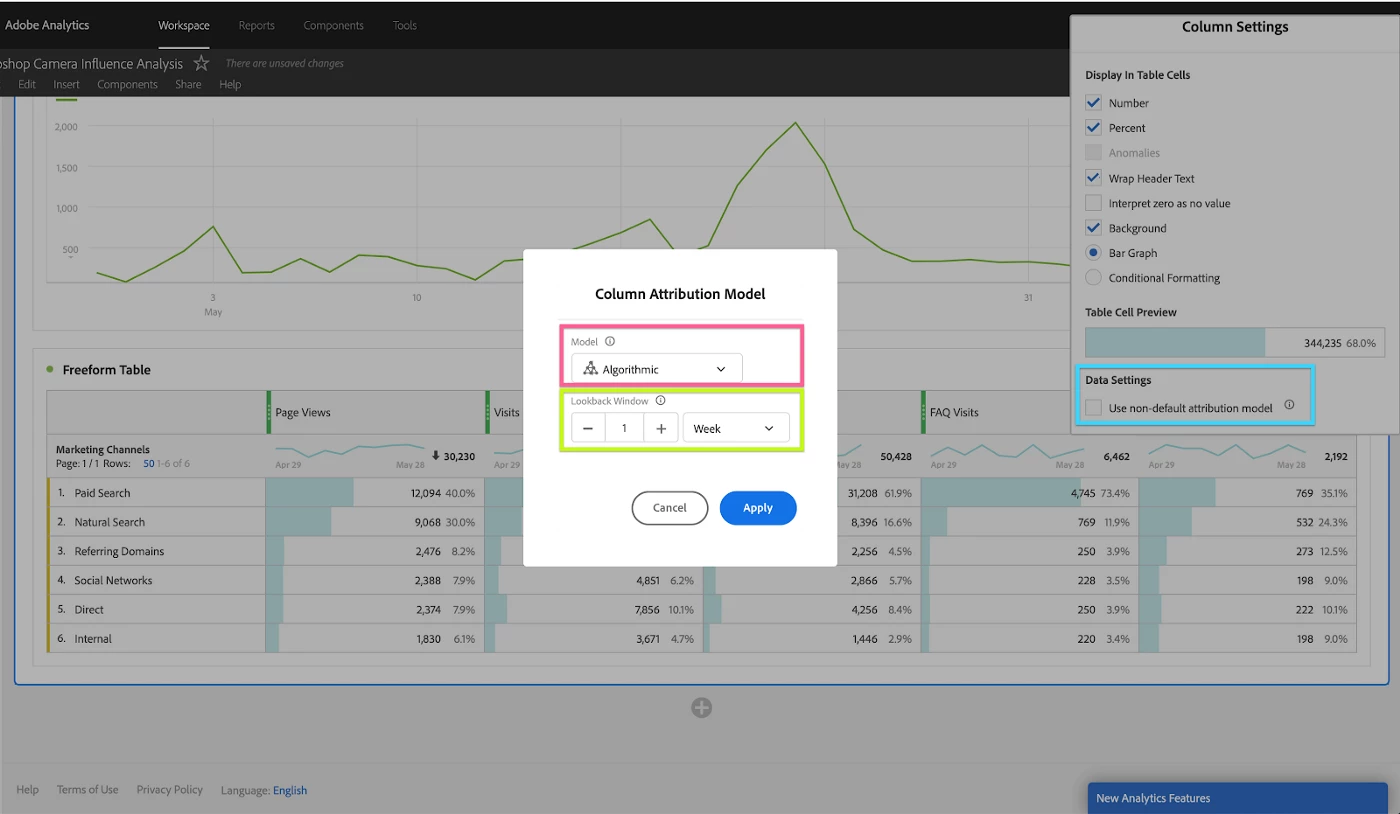
In addition, these same options are available by right-clicking the metric’s column header, and selecting Modify Attribution Model. Finally, right-clicking the metric’s column header and selecting Compare Attribution Models brings you the same options with one additional column which calculates the percent change between each model.
Calculated metrics
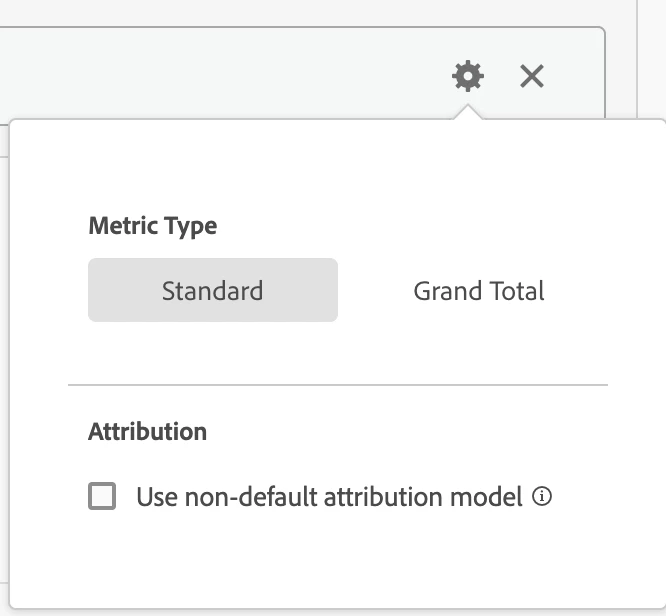
Another way to instantiate Attribution IQ, and therefore the new algorithmic model and Custom Lookback Window, is through the Calculated Metrics Builder. When building your metric, simply click the gear next to any supported metric to find the checkbox to use a non-default attribution model (Figure 4).
Attribution Panel
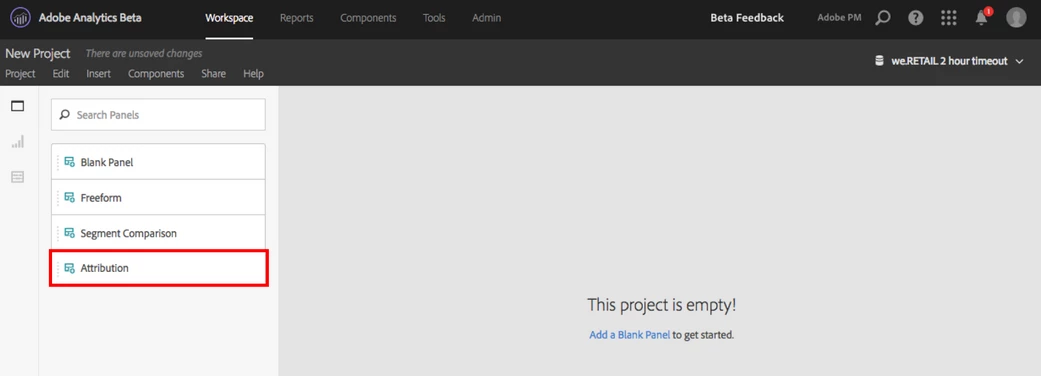
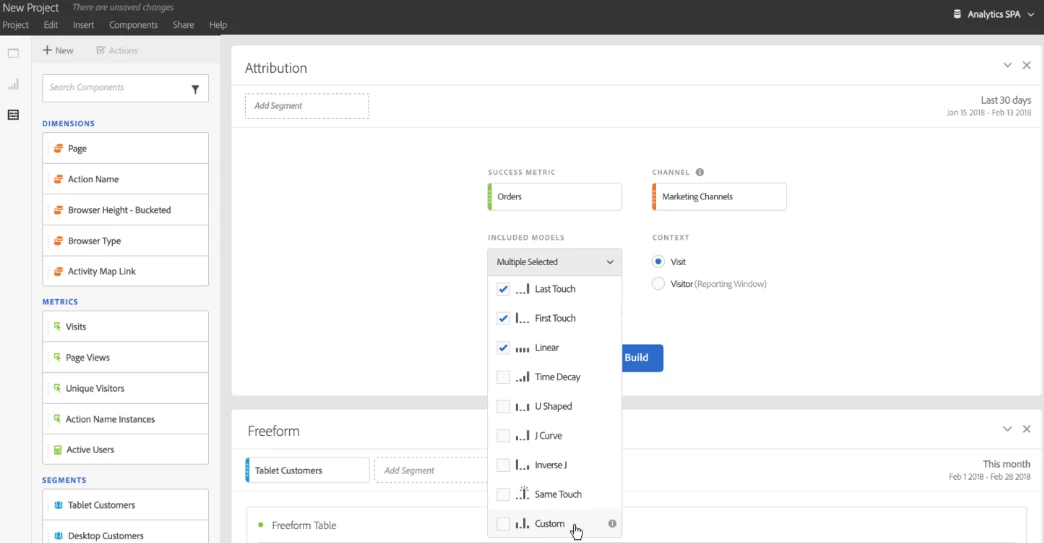
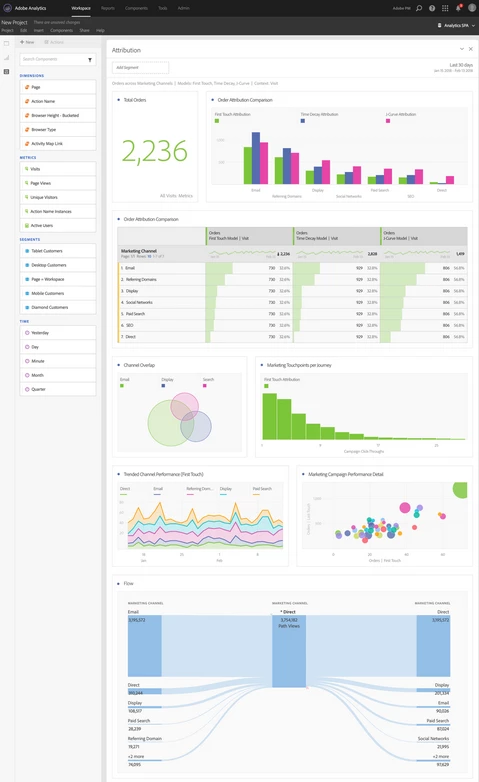
The Attribution Panel is an easy way to build an analysis comparing and contrasting various attribution models. To access the Attribution Panel, click the panel icon on the top left of Workspace’s left rail and drag the Attribution Panel into your project (Figure 5). Here, you can select the attribution models you wish to compare (including Algorithmic Attribution) and the lookback window (Figure 6), which will return a rich set of data and visualizations of how your marketing channels (or other dimensions) work together (Figure 7).
Supercharging your analytics for better business results
To fulfill their true promise, analyses need to be flexible enough to adjust based on the sales cycle. For example, it takes a lot longer for a customer to decide whether to purchase a car than a pair of socks. Therefore, your analytics product needs to be able to incorporate data from the entire consideration period (i.e. along the entire customer journey culminating in conversion) whatever that may be for your business and the products or services you sell. If your company happens to sell both cars and socks, you’ll of course want to take advantage of segments to focus your analysis.
With the combination of Algorithmic Attribution and Custom Lookback Windows — two new and superpowered enhancements that Adobe Analytics is bringing to attribution — you can use your data to gain deeper insights into your customer’s journey to understand how all the different touchpoints interact to trigger the sale. With these new features, Adobe Analytics achieves that and more to help you derive more accurate information more quickly making it immediately actionable throughout your digital experience.
Follow the Adobe Experience Platform Community Blog for more developer stories and resources, and check out Adobe Developers on Twitter for the latest news and developer products. Sign up here for future Adobe Experience Platform Meetups.
Resources
- Adobe Analytics — https://www.adobe.com/analytics/adobe-analytics.html
- Attribution IQ — https://docs.adobe.com/content/help/en/analytics/analyze/analysis-workspace/attribution-iq.html
- Adobe — https://www.adobe.com/index2.html
- Feature Comparison for Different Adobe Analytics Packages — https://www.adobe.com/analytics/compare-adobe-analytics-packages.html
- Algorithmic Attribution — https://docs.adobe.com/content/help/en/analytics/analyze/analysis-workspace/panels/attribution/algorithmic.html
- Machine Learning with Adobe Experience Platform Data Science Workspace — https://www.adobe.com/experience-platform/data-science-workspace.html
- Adobe Sensei — https://www.adobe.com/sensei.html
- Custom Lookback Windows in Adobe Analytics — https://docs.adobe.com/content/help/en/analytics/analyze/analysis-workspace/panels/attribution/attribution.html
- Analysis Workspace — https://docs.adobe.com/content/help/en/analytics/analyze/analysis-workspace/home.html
- Attribution in Analysis Workspace — https://docs.adobe.com/content/help/en/analytics/analyze/analysis-workspace/panels/attribution/use-attribution.html
- Adobe Analytics Attribution Panel — https://docs.adobe.com/content/help/en/analytics/analyze/analysis-workspace/panels/attribution/attribution.html
- Adobe Experience Platform — https://www.adobe.com/experience-platform.html
- Adobe Experience Platform Real-Time Customer Data Platform — https://www.adobe.com/experience-platform/real-time-customer-data-platform.html
- Using Attribution in Freeform Tables — https://docs.adobe.com/content/help/en/analytics/analyze/analysis-workspace/panels/attribution/use-attribution.html#section_F2F72AE840EB4EA781302A559726E6F4
- Attribution IQ in Calculated Metrics — https://docs.adobe.com/content/help/en/analytics-learn/tutorials/analysis-workspace/attribution-iq/attribution-iq-in-calculated-metrics.html
- Calculated Metrics Builder — https://docs.adobe.com/content/help/en/analytics/components/calculated-metrics/calcmetric-workflow/cm-build-metrics.html
- Attribution Panel and Visualizations — https://docs.adobe.com/content/help/en/analytics/analyze/analysis-workspace/panels/attribution/use-attribution.html#section_6B02F28182F14ECC9FC5020F224726E6
- Customer Journey Analytics — https://www.adobe.com/analytics/customer-journey-analytics.html
- Shapley, Lloyd S. (1953). A value for n-person games. (reprinted as Chapter 2 in The Shapley value: Essays in honor of Lloyd S. Shapley — http://www.library.fa.ru/files/Roth2.pdf
- Harsanyi, John C. (1963). A simplified bargaining model for the n-person cooperative game. International Economic Review 4(2) , 194–220. — https://link.springer.com/chapter/10.1007%2F978-94-017-2527-9_3
Originally published: Jul 2, 2020

