Expand my Community achievements bar.

Dive into Adobe Summit 2024! Explore curated list of AEM sessions & labs, register, connect with experts, ask questions, engage, and share insights. Don't miss the excitement.
SOLVED

Memory Leak Analysis

Avatar

Level 4

Hello,

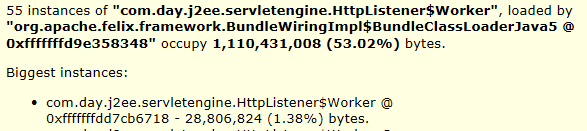
We've had memory leak issues for a while that will eventually push our publishers into 100% GC after a week or two. Up until now we've just been ignoring them because it's easier to restart the publisher but i would like to really understand how to troubleshoot this. We have a heap dump but what i'm seeing doesn't seem that helpful. All of the classes it references are framework classes, so i'm not sure how to proceed in finding the actual cause of the leak in our code. Below is the main leak suspect "HttpListener" loaded by "BundleWiringImpl" -

There are hundreds of these instances, each with a URL that is called by the end user. The below example is a keepalive call to a static html page, so none of our custom code should even be running.

Does anyone have suggestions on how to proceed here? Every time we take a heap dump the problem suspects are from "org.apache.felix.framework.BundleWiringImpl$BundleClassLoaderJava", "com.day.j2ee.servletengine.HttpListener", and "com.day.j2ee.servletengine.ServletHandlerImpl".

We are still on 5.6.1


Thanks

1 Accepted Solution

Avatar

Correct answer by
Level 10

I would recommend opening a ticket - there may be a required hotfix. Looks like some sort of bug and the support team can help. 

View solution in original post

13 Replies

Avatar

Level 4

Thanks for that, i did read through those earlier but they seem to end about where i am now. The examples i've found all have obvious leak suspects, such as a custom class, so i'm not sure how to handle the leak suspects being part of CQ's framework classes. It just seems like all HTTP/Servlet calls are causing memory leaks.

Avatar

Correct answer by
Level 10

I would recommend opening a ticket - there may be a required hotfix. Looks like some sort of bug and the support team can help. 

Avatar

Level 4

Ok, we will do that then. Thank you!

Avatar

Level 9

Hi,

You are connecting to external service which does not have timeout configured. Make sure your external access have timeout set.

Thanks,

Avatar

Level 4

Hm, that's definitely a possibility because we do connect to multiple other systems. What did you see that led you to that conclusion?

Avatar

Level 3

It is obvious from the screenshot you have uploaded.

Closetion.123I.html and ic_kal.html seem to be retaining a lot of heap space. it's likely these requests are getting stuck. you might also want to verify the underlying page component.

there are several online documents that you can refer to for analyzing heap dumps. the one below has helped me numerous times in resolving memory leak issues. hopefully it would serve you the same.

http://docwiki.cisco.com/wiki/How_to_analyze_heap_dumps 

Avatar

Level 4

I'll take a look at that document, thanks.

For ic_kal.html, it is literally an html file stored under /content with - "<html><body>OK</body></html>", so there is no template or underlying page component that i'm aware of. That's why i chose this as an example, because it shouldn't be doing any processing besides serving the doc. However, i'm guessing if there are other pages causing issues this one could have just been caught after we were already at 100% GC

Avatar

Level 9

jocamp wrote...

Hm, that's definitely a possibility because we do connect to multiple other systems. What did you see that led you to that conclusion?


http thread not released & it can be external connection most of time. Also based on experience since we have many backend integration with other legacy system line number & class are familiar.   If you can send heap dump easy to figure out culprit. Problem is heap dump will have all the data including some of your security environment info & hence not good idea to discuss on open forums. 

Avatar

Level 2

I agree, external connection could be an issue here since Sling does return back HTTP to the thread pool. One quicker way to know all this will be taking 20 thread dumps every 500ms and then going through those which are running or in waiting state. Hopefully you will get something interesting there. However one thing I would like to know- what is the thread pool size configured in this server?

Avatar

Level 2

Hi Team,

We are also facing similar issues.

Everyday we are seeing publisher 1 or publisher 2 having issues (Major issue is old generation space reached 100% )and due to this admin is just restarting the instances.

Below is the link for head dump analysis.

https://fastthread.io/my-thread-report.jsp?p=c2hhcmVkLzIwMTkvMDgvMjIvLS1qc3RhY2suMTU0NDguMTAxMzEwLjc...

This may be the memory issue but we don't have clues in application. Someone please verify link and suggest.

Avatar

Employee Advisor

Hello,

For memory-related issues, you should also take a heap dumps along with thread dumps. The link that you have provided is for thread dumps, not heap dumps.

Follow the link [1] to see instructions to take heap dumps. Also, review the memory usage here: http://aem-host:port/system/console/memoryusage screen

I suggest you open a Daycare ticket and provide heap dumps, thread dumps, aem logs etc for analysis.

[1] Analyze Memory Problems