AEM Publish Memory Usage vs System Monitoring Report - High Heap Memory Utilization

- Mark as New
- Follow
- Mute
- Subscribe to RSS Feed
- Permalink
- Report
Hi AEM Community,
I am trying to figure out the reason for high heap memory utilization.
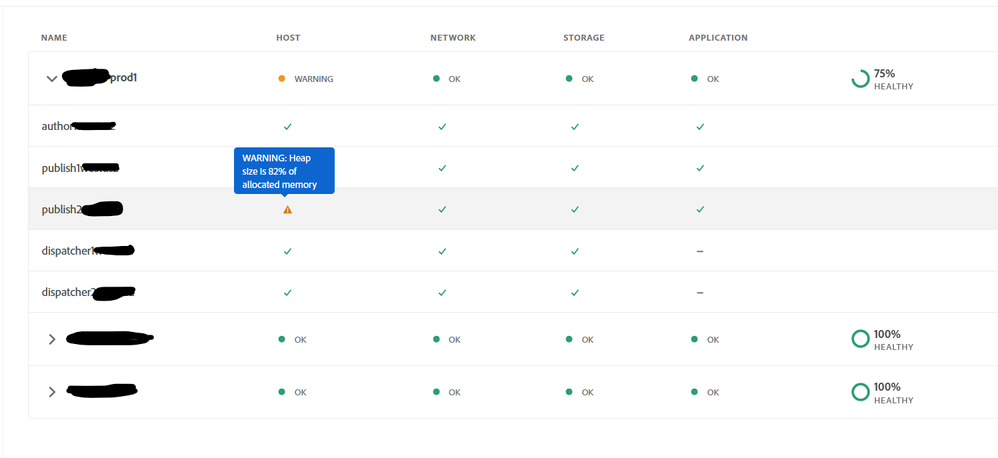
When navigating to the Reports -> System Monitoring, we see the below warning -
One of the publish server has high heap size which is 82% of the allocated memory.
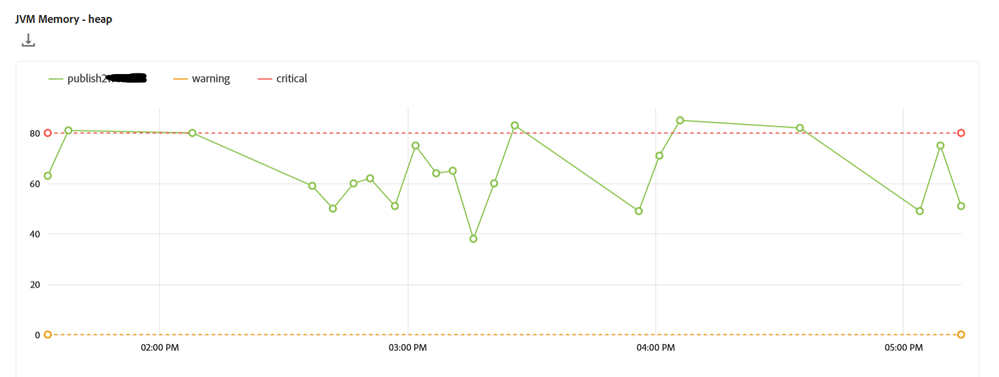
Checking the publish server's JVM Memory (Heap) we see the below -
Checking the same publish instance's memory usage at /system/console/memoryusage, we see the below stat -
The overall heap memory usage as per the above table is as following -
init = 4.29 Gb
used = 2.09 Gb
committed = 4.08 Gb
max = 4.08 Gb
If the above stat is true then the used heap memory is slightly less than 50% and not the 82% as displayed in the warning.
Am I reading these two stats correctly or is there something I am missing?
@arunpatidar, @EstebanBustamante, @Jörg_Hoh, @aanchal-sikka
We are still combing through our error logs, heap dump and thread logs to figure out what's causing the spike.
Thanks in advance,
Rohan Garg

Solved! Go to Solution.
Topics help categorize Community content and increase your ability to discover relevant content.
Views
Replies
Total Likes

- Mark as New
- Follow
- Mute
- Subscribe to RSS Feed
- Permalink
- Report
Here's the reply from Adobe CSE for the discrepancy-
Regarding your question about discrepancies between memory utilization reports from different sources can be due to several factors, including differing collection times, metrics calculation methods, and specific memory pool.
- Collection Times -
Memory usage can fluctuate significantly over short periods, especially on a system under varying loads. If the Cloud Manager's report and the server's memory stats were not taken at the exact same time, this could account for the difference. The Cloud Manager might be displaying an average or peak usage over a period, while the server's stats could be showing the current or average free heap memory at a different time. - Metrics Calculation Methods:
The Cloud Manager might consider only certain types of memory within the heap or include other memory spaces in the JVM, such as Metaspace or Code Cache, in its calculations, while the server's stats might be reporting strictly on the heap memory. - Specific Memory Pools:
The JVM heap is divided into several memory pools (Young Generation, Old Generation, etc.), and monitoring tools might report on these differently - Memory Allocation vs. Usage :
There might be a difference between allocated memory and used memory. It's possible that the server's stats are showing allocated heap memory that is not yet fully used, which could explain the 50% free memory, while the Cloud Manager might be warning about actual usage patterns that frequently reach or exceed 80% of the heap. - Garbage Collection Activity:
The Cloud Manager's report could be taking into account the frequency and duration of garbage collection events
Thanks,
Rohan Garg


- Mark as New
- Follow
- Mute
- Subscribe to RSS Feed
- Permalink
- Report
Hey Rohan
From the chart you shared, it appears that there are some spikes, and the performance issue decreases at certain points. There could be a chance that you are looking at the "memory stats" where the instance is performing okay. I think ideally, we should check this once the spike is reported or flagged by the other tool. The key is the heap dump to understand what triggered the spike; perhaps there is a memory leak or something similar.
Hope this helps
Esteban Bustamante


- Mark as New
- Follow
- Mute
- Subscribe to RSS Feed
- Permalink
- Report
Hi @EstebanBustamante , Thanks for the reply!
I agree that there is a chance that the memory stat and the graph don't match at the same time but we tried it multiple times during the day to lower that probability.
Currently there is no other tool (New Relic etc.) setup to report such a spike.
Any particular tool you prefer which helps map the issues flagged in heap dump to the class files in the codebase?

Views
Replies
Total Likes

- Mark as New
- Follow
- Mute
- Subscribe to RSS Feed
- Permalink
- Report
No preference, usually I worked with Eclipse MAT for dump analysis.
The data may make sense because the threads are holding up because there is no memory to execute them, you will still have to keep looking at what could cause the memory to be consumed and not released. Do you have huge indexes? maybe check when was the last time the index ran.
Esteban Bustamante


- Mark as New
- Follow
- Mute
- Subscribe to RSS Feed
- Permalink
- Report
No, the indexes aren't huge actually.
My best guess is there are great many instances of open resource resolvers which are causing memory leaks.
I am using Eclipse MAT too but its a little tricky to trace the error reported to the custom application code files that ways.
Thanks for your help!
I have also raised a support ticket to ask about the difference in Reporting console stats and memory usage stats in configMgr.
Thanks,
Rohan Garg

Views
Replies
Total Likes

- Mark as New
- Follow
- Mute
- Subscribe to RSS Feed
- Permalink
- Report
Here's the reply from Adobe CSE for the discrepancy-
Regarding your question about discrepancies between memory utilization reports from different sources can be due to several factors, including differing collection times, metrics calculation methods, and specific memory pool.
- Collection Times -
Memory usage can fluctuate significantly over short periods, especially on a system under varying loads. If the Cloud Manager's report and the server's memory stats were not taken at the exact same time, this could account for the difference. The Cloud Manager might be displaying an average or peak usage over a period, while the server's stats could be showing the current or average free heap memory at a different time. - Metrics Calculation Methods:
The Cloud Manager might consider only certain types of memory within the heap or include other memory spaces in the JVM, such as Metaspace or Code Cache, in its calculations, while the server's stats might be reporting strictly on the heap memory. - Specific Memory Pools:
The JVM heap is divided into several memory pools (Young Generation, Old Generation, etc.), and monitoring tools might report on these differently - Memory Allocation vs. Usage :
There might be a difference between allocated memory and used memory. It's possible that the server's stats are showing allocated heap memory that is not yet fully used, which could explain the 50% free memory, while the Cloud Manager might be warning about actual usage patterns that frequently reach or exceed 80% of the heap. - Garbage Collection Activity:
The Cloud Manager's report could be taking into account the frequency and duration of garbage collection events
Thanks,
Rohan Garg

Views
Likes
Replies


