Expand my Community achievements bar.

Join us at Adobe Summit 2024 for the Coffee Break Q&A Live series, a unique opportunity to network with and learn from expert users, the Adobe product team, and Adobe partners in a small group, 30 minute AMA conversations.
SOLVED

Volume differential in Freeform Table Adobe Analytics Workspace

Avatar

Level 1

Hello,

Here the thing, when I created my Freeform Table in the workspace I selected my segments, then a metric & a dimension.
The table shows me the sum of the volume of my metric (on the first line of my dimension). Then there is all the rows just under. When I extracted the table in CSV and in Excel, I do myself the sum, it appears that there is a huge gap of volume, with much more volume in my Excel...

I tried to understand, but it appears that the more specific is my metrics (Day -> hour -> minute) the more raws I have & the bigger is the difference.

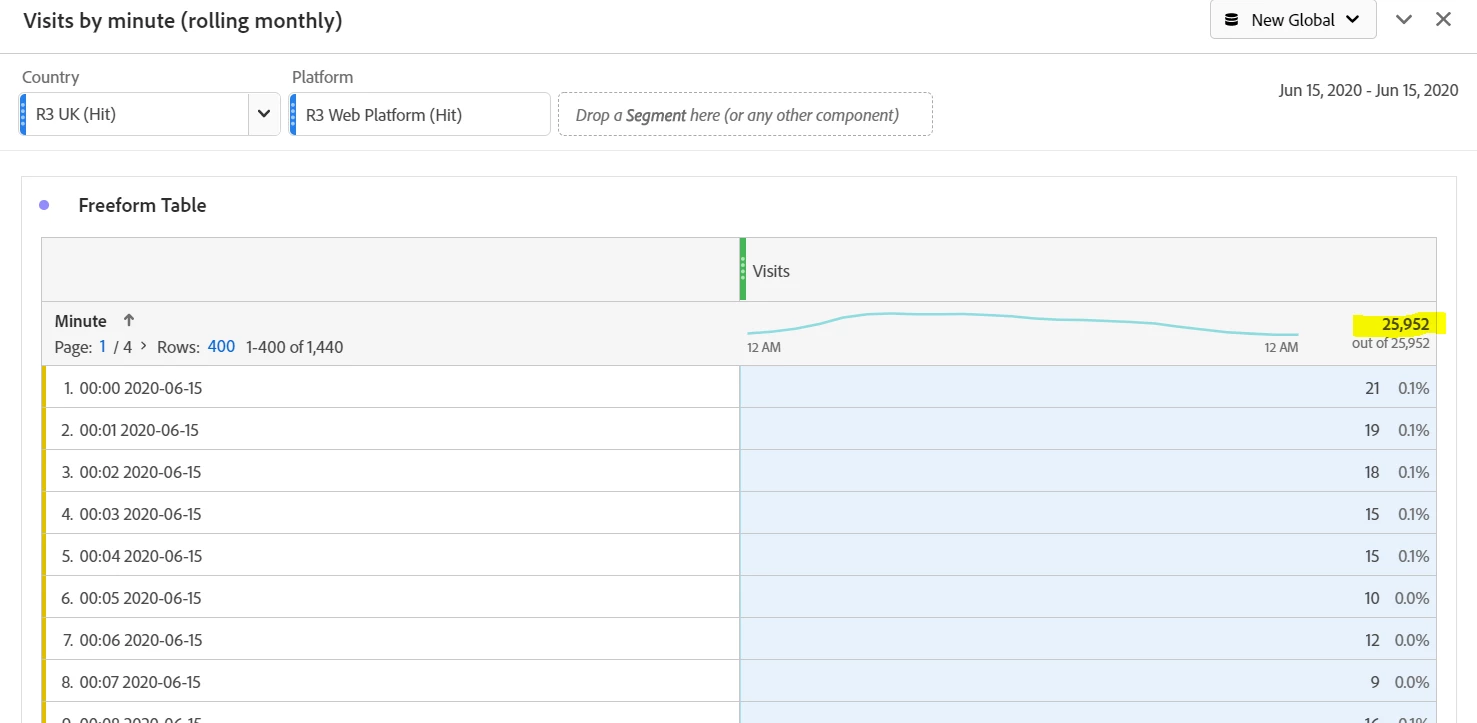
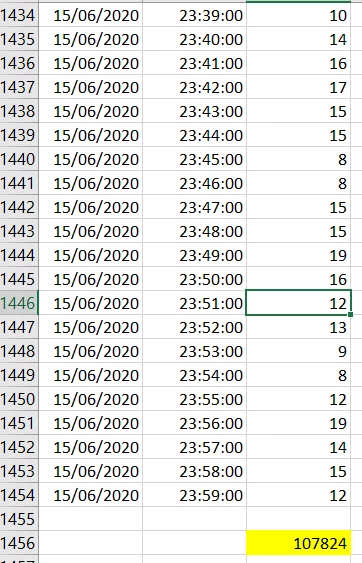
You will the see concretely in the screens associated, that I have 25972 "visits" on the 15 of June and when I did my Excel extract I finally get 107 824 "visits" !

Does someone had the same issue or is it specific to my data ?Freeform table Adobe Analytics.PNGExcel Extract from Freeform table Adobe Analytics.PNG

1 Accepted Solution

Avatar

Correct answer by
Community Advisor

You can't add up Visits (not Visitors) across time just by summing up the row numbers.

Remember that a Visit comprises a series of hits over a span of time. So in your report, the same Visit could be reported at 00:00 and 00:01 and 00:02 etc. The same logic applies to Visitors.

AA conveniently deduplicates these in its header sum. You can't do that deduplication in Excel.

View solution in original post

8 Replies

Avatar

Correct answer by
Community Advisor

You can't add up Visits (not Visitors) across time just by summing up the row numbers.

Remember that a Visit comprises a series of hits over a span of time. So in your report, the same Visit could be reported at 00:00 and 00:01 and 00:02 etc. The same logic applies to Visitors.

AA conveniently deduplicates these in its header sum. You can't do that deduplication in Excel.

Avatar

Level 1
Thank you yuhuisg, that's a problem for me... How can I isolate like AA in Excel ? Is there any solutions ?

Avatar

Community Advisor
@DylanAm75 you can use AA's Report Builder addon for Excel to import the data directly into Excel. That will give you the same results as what you see in Analysis Workspace. Otherwise, if you're trying to do this manually, then you will never be able to get the same numbers, because AA is able to deduplicate the numbers in its backend.

Avatar

Level 1
Unfortunately, in AA's Report Builder we can't select a "minute" view, the deeper you have is "hour"...

Avatar

Level 1

Or maybe you know how to select "minute" in Report Builder space ?

Avatar

Community Advisor

I guess Report Builder's not an option then.

Actually, why do you want to sum up the per-minute Visits? If you need to get the number of visits between, say, 12:00am and 12:17am, you can still report on the total Visits, but apply a segment that gets the data from your particular time period. Then AA will return the sum to you, and also perform the necessary deduplication.

Avatar

Level 1

We need a per-minute visits deduplication to be able to our system to scroll & recover the website traffic. Then we have many small periods of time where our algorithm will work.
The only solution I see is to apply in my Excel file a division, calulated from the header sum vs all my Excel raws. To keep a consistency in numbers.
In that case the division will be : (107 824 / 25952 = 4,15...).
Even if we don't really know for each minute the weight of new vs "old" visits.

Avatar

Level 10
Do any of the answers below answer your initial question? If so, can you select one of them as the correct answer? If none of the answers already provided answer your question, can you provide additional information to better help the community solve your question?