Expand my Community achievements bar.

SOLVED

Understanding a web sdk AA implementation as a business user?

Avatar

Level 1

I just joined a new company running Adobe Analytics with a Web SDK implementation. Now I want to understand the props, events, and EVARs being sent on my new company website when interacting with different elements. How can I best do this? Thanks

1 Accepted Solution

Avatar

Correct answer by
Level 10

I am assuming you want to see what calls are fired when you interact with the site, rather than the question being about knowing the definitions of the various variables.

I use three different "debugger" tools for this. One is the Experience Platform Debugger, which is a Chrome extension. Another is the debugger under the Chrome developer Tools. My favorite is Fiddler. This is a free, stand alone debugging tool.

Here is a screenshot of the Adobe debugger (with two calls):

RobertBlakeley_0-1693935906765.png

Here is a screenshot of Fiddler:

RobertBlakeley_1-1693935963431.png


To get the Adobe debugger:

After you install the Chrome extension or Firefox add-on, an icon is added to the extension bar:


For Fiddler:

  1. Go to: https://www.telerik.com/fiddler/fiddler-classic
  2. Click on the “Download” link.
  3. Fill out the form and download the file.
  4. Double click and follow the instructions.


View solution in original post

3 Replies

Avatar

Correct answer by
Level 10

I am assuming you want to see what calls are fired when you interact with the site, rather than the question being about knowing the definitions of the various variables.

I use three different "debugger" tools for this. One is the Experience Platform Debugger, which is a Chrome extension. Another is the debugger under the Chrome developer Tools. My favorite is Fiddler. This is a free, stand alone debugging tool.

Here is a screenshot of the Adobe debugger (with two calls):

RobertBlakeley_0-1693935906765.png

Here is a screenshot of Fiddler:

RobertBlakeley_1-1693935963431.png


To get the Adobe debugger:

After you install the Chrome extension or Firefox add-on, an icon is added to the extension bar:


For Fiddler:

  1. Go to: https://www.telerik.com/fiddler/fiddler-classic
  2. Click on the “Download” link.
  3. Fill out the form and download the file.
  4. Double click and follow the instructions.


Avatar

Community Advisor

You should also inquire with the team about documentation. This should show you what is being collected and where on your site (assuming your team has proper documentation).


While you can look at the calls, this will show you one page at a time.. but trying to understand the context of what is being tracked and where that information is available will be hard.


Using a combination of looking at the specific data and the documentation will give you the best overall understanding of your site.

Avatar

Community Advisor

It sounds like the problem is that you are used to being able to see what is being sent to which eVar/prop/event by navigating around your website and looking at what is happening in your browser, but since moving to a company that uses Web SDK the old way you did this doesn't work and you are unsure how to do this with Web SDK?


If so, how your new company has implemented Web SDK will determine whether or not you can continue to work in the way you were used to.


When using the Web SDK, the structure of the data sent from your browser is in a more generic format using Adobe's XDM object (e.g. no props/evars/events).  This is done to make it easier for multiple capabilities to utilise the same data (rather than having something that is very Adobe Analytics specific).


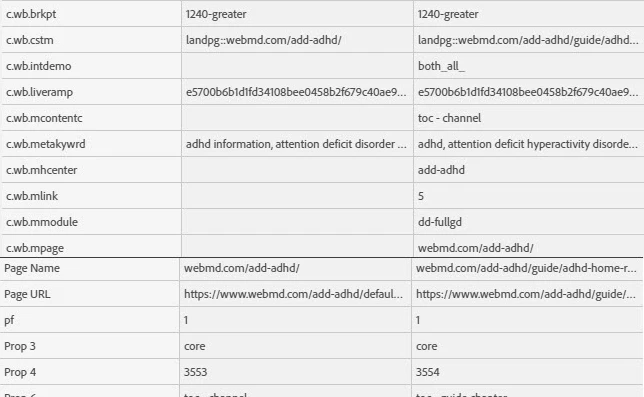
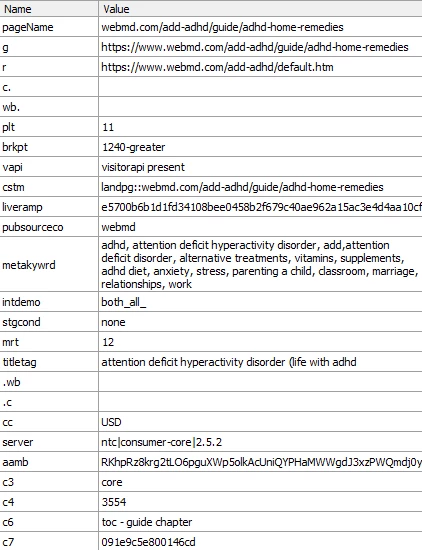
Your company's first option when implementing Web SDK would be to send this generic data object back the Adobe server and then map the values to props, eVars, and events using Adobe Analytics processing rules.  If this is the approach you cannot see prop/evars/events by looking at what is going on in the browser (you can see the values passed, but you won't know which variable they end up in without also understanding the processing rules that have been set up server side).  If this is the case, you will need to come up with another way of working.


Your company's second option when implementing Web SDK would be to use a special part of the XDM object that allows the values to be directly mapped to props/eVars/events without the need for server side processing rules.  If your company has used this method you can see which props/evars/events are receiving data - you just need to know where to look.


To view this special part of the XDM object that enables direct mapping, use the Adobe Experience Platform Debugger as follows:


1) launch the debugger

2) Select "Experience Platform Web SDK" from the left hand menu (you may previously have been used to selecting "Analytics")

3) under network requests you should see the data being sent back to Adobe

4) you can see the full object that is being passed back if you click into "POST body"

5) for the part of the object that auto maps to Adobe Analytics variables you need to drill down into the JSON object under events > xdm > _experience > analytics  (If this doesn't exist then it looks like your company went with the first option )

Andrew_Wathen__0-1694171468085.png


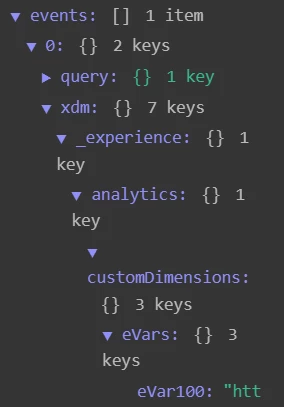
Note: the format is a bit difficult to read in the debugger


Hope this helps,

Andrew