Segments with a visitor container and breakdown by day dimension | Community
Skip to main content
kjz36074788
July 13, 2022
Solved

Segments with a visitor container and breakdown by day dimension

  • July 13, 2022
  • 2 replies
  • 4504 views

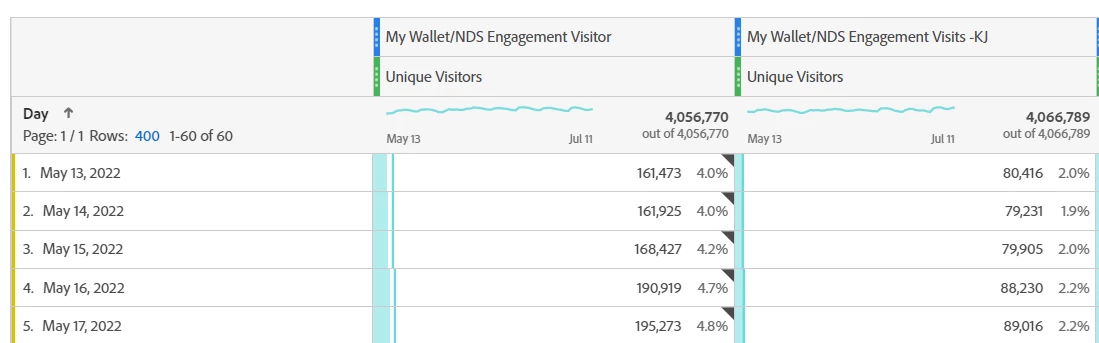
I created a segment of users who had credit application clicks using a visitor container.  I used the month of April as the panel date range.  And there're about 4 million users (unique visitor). When I added a day dimension there're about 160K unique visitor each day.  What does the 160K mean?   Active unique visitor in each day who had made credit application in the month of April?    Because if I switch the segment container to visit level, the total is still 4 million users (unique visitor), but the daily visitor is much lower about 80K.

If I want to build a dashboard for the IT team to improve the engagement of credit applications, which segment container is better?  I feel like the visit level contain provides better information on the day level.  Is that right?


This post is no longer active and is closed to new replies. Need help? Start a new post to ask your question.
Best answer by Jennifer_Dungan

Just to add to this fine answer, when you create a segment at visitor level.. this is lifetime of the visitor (did this user ever do this action.... when you pull that into your report, it will limit the data to the "users that ever performed that action" that came to the site during your time frame.


Visit is definitely more focused, cause they need to have performed the action within the time frame... 


In many cases, I still prefer to use "hit" level in a lot of my segments... if I pair this with the UV metric, I still get the data I need (UVs who did X) but then if I want to get the count of actions (I don't get all the PVs in the entire visit that need to be filtered out)

2 replies

leocwlau
Community Advisor and Adobe Champion
July 13, 2022

When you use 'visitor' as the container, the table will match any visitor who had credit application clicks regardless of when that happened. It means there are 160K visitors on a particular date visiting your site and they had credit application clicks at any point in time.

When using 'visit' as the container, it limits the credit application clicks to the corresponding visit. So the 80K means there are 80K visitors visiting your site and had credit application clicks on that day as well.

Jennifer_Dungan
Community Advisor and Adobe Champion
Jennifer_DunganCommunity Advisor and Adobe ChampionAccepted solution
Community Advisor and Adobe Champion
July 13, 2022

Just to add to this fine answer, when you create a segment at visitor level.. this is lifetime of the visitor (did this user ever do this action.... when you pull that into your report, it will limit the data to the "users that ever performed that action" that came to the site during your time frame.


Visit is definitely more focused, cause they need to have performed the action within the time frame... 


In many cases, I still prefer to use "hit" level in a lot of my segments... if I pair this with the UV metric, I still get the data I need (UVs who did X) but then if I want to get the count of actions (I don't get all the PVs in the entire visit that need to be filtered out)

June 11, 2023

@msappenfield you just have to be careful in creating your segments...


Using your example:

A visitor segment that includes order = 10 and date range = 2022


You have created a date specificity inside your segment, that will restrict those 10 orders to happen within 2022.... 


The original post was about creating a segment:

A visitor segment that includes order = 10

and simply using the report range to define the date...


But order = 10 could (and should be for all time).... then like you suggested apply a 2022 year range to limit the segment specifically to last year)


However, it looks like Adobe has changed the logic.... the Panel Date Range is providing definition... but that's NOT good.. now I can't create segments to look for Visitors that have ever signed up for a newsletter, or ever made a purchase...


I suppose I can do the opposite and create a full look-back range... 


But this shift could fundamentally break existing reports for a lot of people who expect Visitor segments to be "All Time" by default....


@jennifer_dungan 

Your response was extremely helpful, I really appreciate it!


Best,

Mike


Biggsy50
Level 3
August 30, 2024

@jennifer_dungan Related to this I saw your tip of turning fallout funnels into tables ... and then further breaking them down by time periods at 22:20 in the Rockstar video - https://business.adobe.com/summit/2024/sessions/2024-adobe-analytics-rockstars-top-tips-and-tricks-s104.html.


This works well looking at the aggregated behaviour for the whole month, e.g. July.


Question -  However, does using a VISITOR segment to further break down the panel date range, e.g. July, into say weeks unfairly boost the later weeks in July?

Segment = 'VISITOR - All Page Track (v6) equals product detail'

  1. For example you may have a VISITOR going to the site on W/C Monday 1st July, and in that visit they see a Product Page (step 1). So far so good.
  2. They then return to the site W/C 22nd July but ONLY visit the Home page. However, in this case the segment asks “Has that VISITOR seen a Product Page in July?” and this will be true, even though they didn't actually see a product page in W/C 22nd July.
  3. W/C 22nd July will then “incorrectly” record a VISITOR seeing a Product Page & there will then be an inflated % of VISITORS seeing a Product Page in that week.

Instead should any fallout segments that are going to be further split out by day or week be HIT (or VISIT) segments to prevent this?


Thanks,

Steve Biggs

Jennifer_Dungan
Community Advisor and Adobe Champion
August 31, 2024

Well to be fair.. regular fallouts will have this same issue when you are looking at Visitor scope....


But of course, a normal fallout will be in aggregate, whereas breaking the table down by times could cause the same user to be in "step 1" in day/week/etc 1, and "step 2" in day/week/etc 2, which could cause some "interesting" challenges in the data.


While I might use Visitor segments for an aggregate "table replication", I think it could cause confusion with time breakdowns... and you might be thinking, why would I use a table for aggregate, when Fallout already does that? Well for that, I would consider readability and consistency with other reports... or just having more control over the success rates (since I have more control over the math in the table - like doing a step to step success, rather than a start to step each time....) 


But to answer your question in general, I've really only used Visits when using this method (you can't use HIT for sequential)... but since our "purchase flow" is for a subscription and not a full shopping cart experience, that works well for me...


But maybe you can get creative and use Visit segments, but maybe have a Visitor segment inside of that... like maybe you could include visitors that have added content to their cart during the period, but look at the checkout flow within a visit? Get creative! I would love to see what you come up with!

Biggsy50
Level 3
August 31, 2024

Top stuff! Thank you. I just wanted to make sure I wasn't going down the wrong avenue. If I understand the output better then my clients will understand it better too. I will explore further next week 🙂