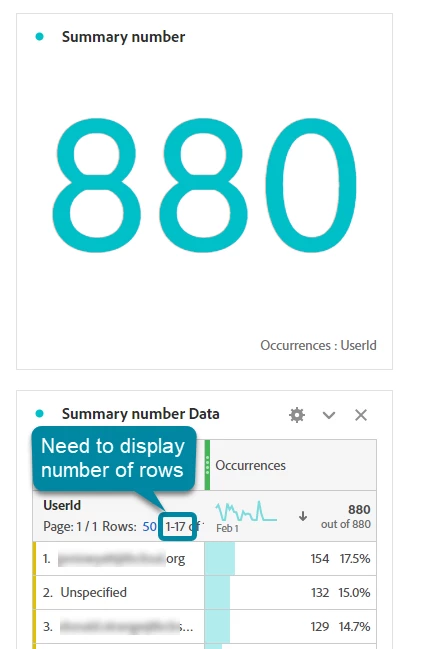
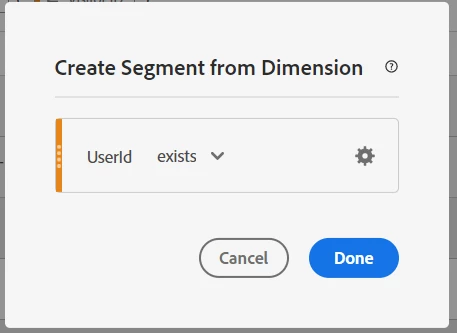
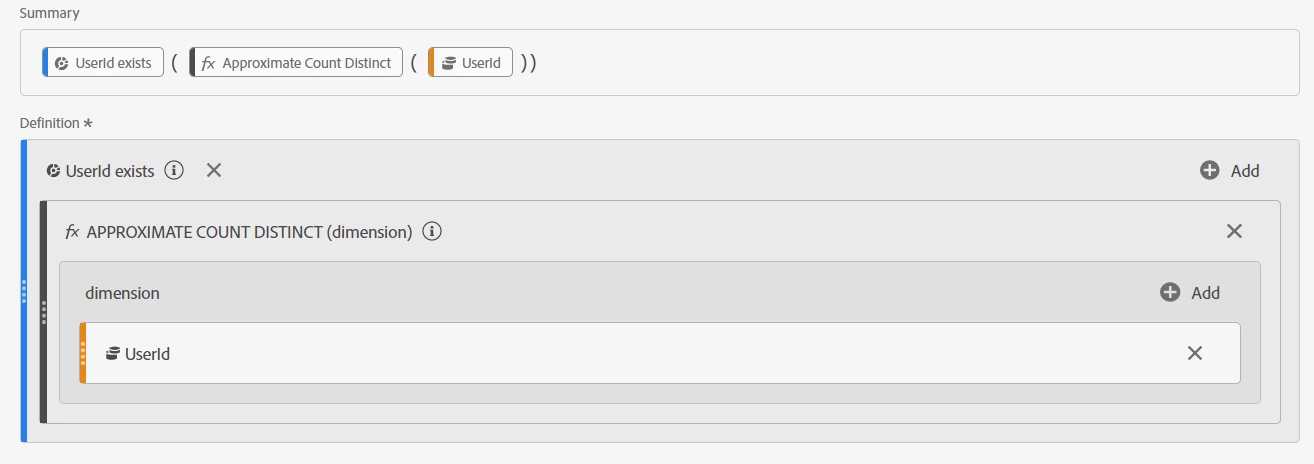
I'm trying to show the number of unique values/rows in a dimension. Specifically, we collect the UserID of each visitor. I want to show the number of unique UserIDs within a segment.
I tried using the Summary Number visualization, but that sums the values of the occurrences.
Create a calculate metric using "Approximate Distinct Count" function.
If you want to remove the "unspecified" values. you can also add an on-the-fly segment for "UserId exists" (simply drag your UserId dimension into the calculated metric above the "Approximate Count Distinct" function
Create a calculate metric using "Approximate Distinct Count" function.
If you want to remove the "unspecified" values. you can also add an on-the-fly segment for "UserId exists" (simply drag your UserId dimension into the calculated metric above the "Approximate Count Distinct" function