Expand my Community achievements bar.

Webinar: Adobe Customer Journey Analytics Product Innovations: A Quarterly Overview. Come learn for the Adobe Analytics Product team who will be covering AJO reporting, Graph-based Stitching, guided analysis for CJA, and more!
SOLVED

Flow Chart: Starts with vs. Contains

Avatar

Level 2

Hello All,


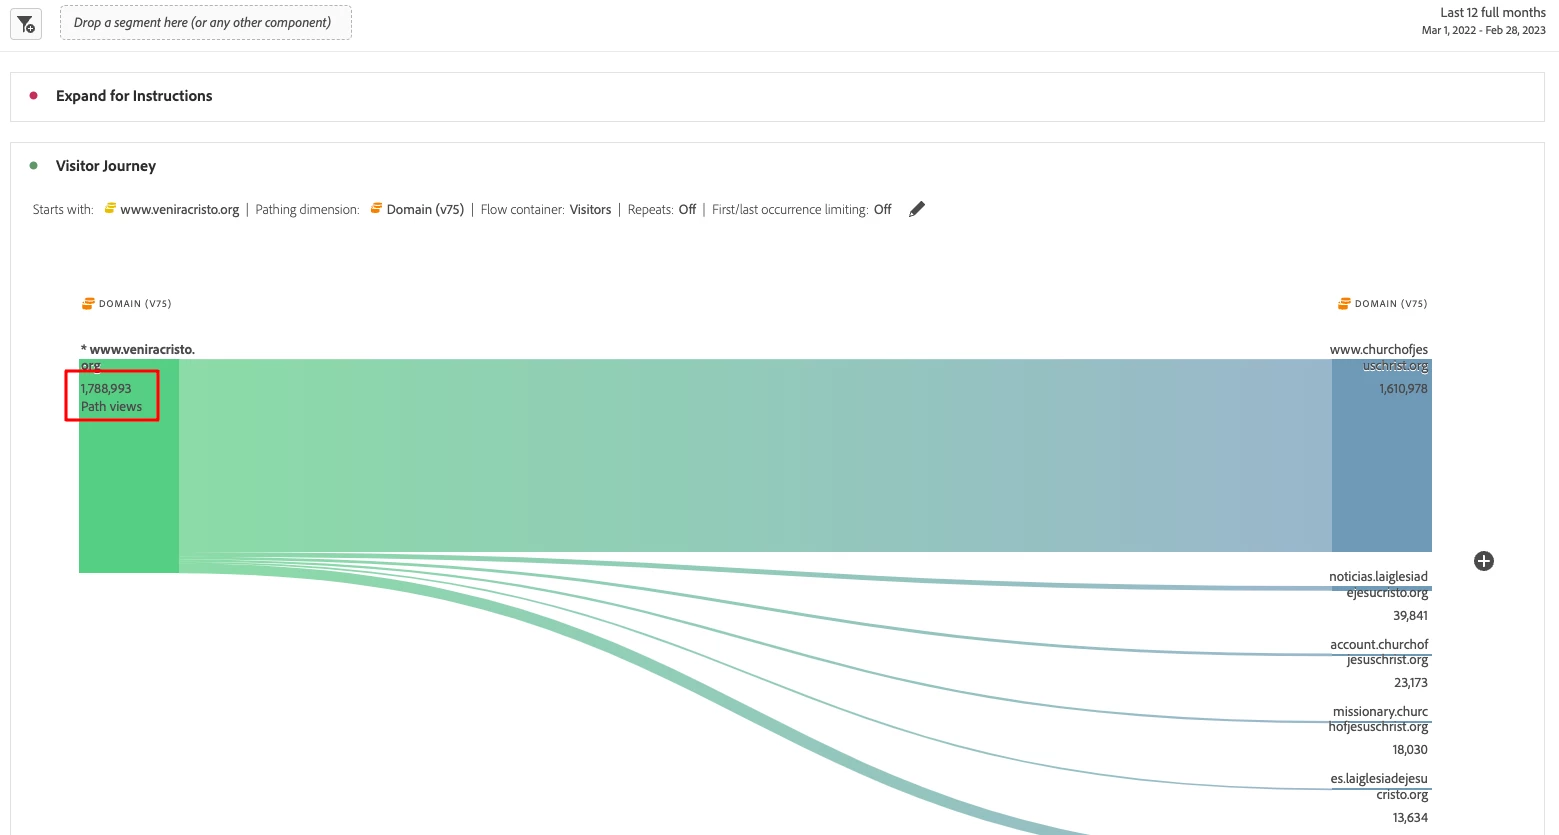
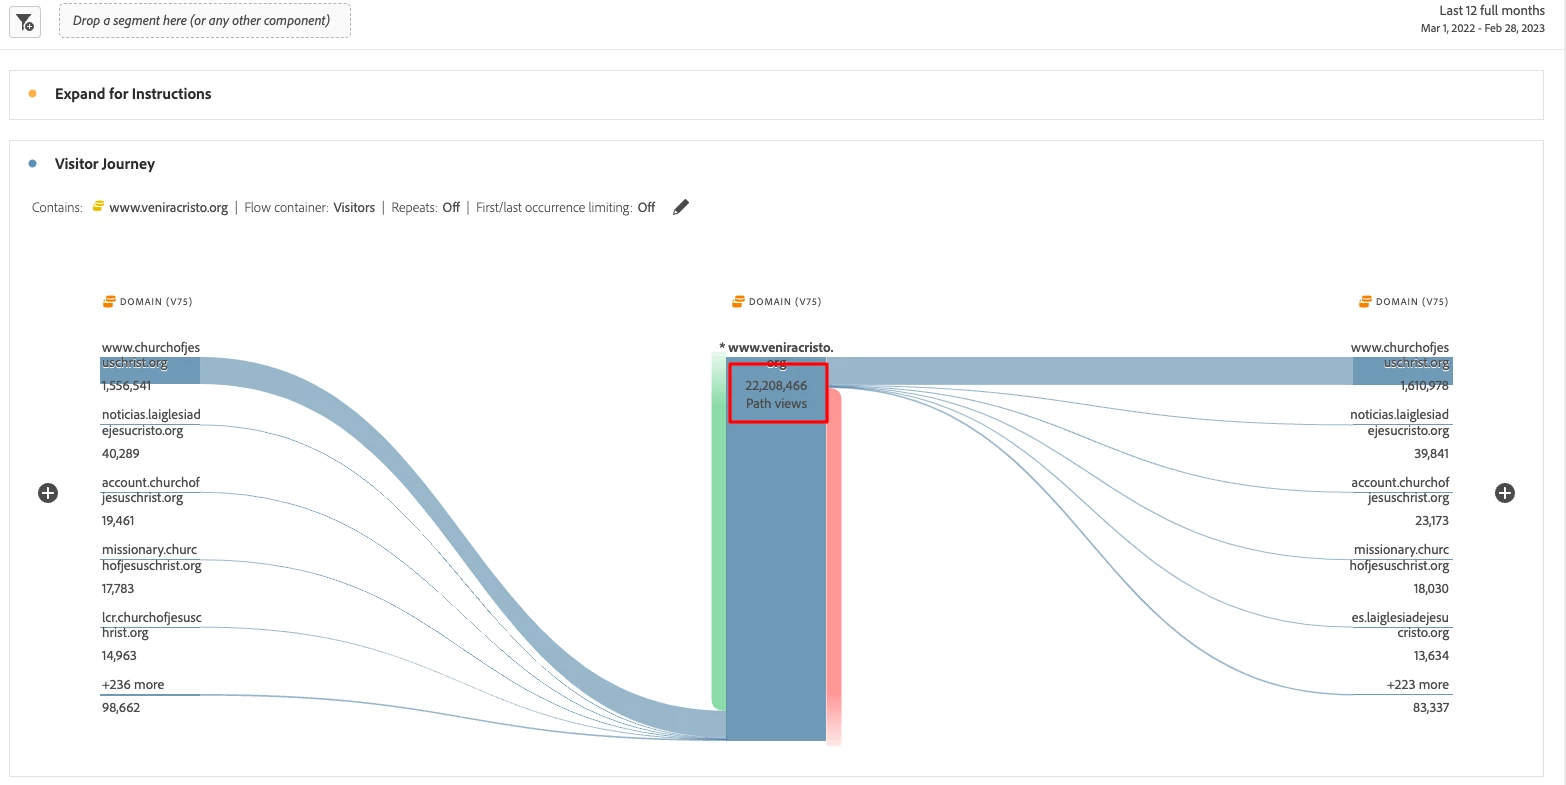
Does anyone have any insights into the difference between putting a dimension as the starting point of the Flow chart vs. Contains (mid-point?). I assumed that if a dimension item (in this case a custom dimension focused on a specific site), is placed as a starting point then it would show path views from those visitors who entered and started their visit within that dimension item. 


However, if I compare two charts, one where the dimension item is placed as the starting point and one where the dimension item is placed in "contains", the number of entries and path views are significantly more for the one where it just "contains" the dimension item. I'm assuming I'm not understanding how the flow diagram works? Or maybe it's just our custom dimension? If anyone has any insights that be very much appreciated. Thank you!
CRichwine_0-1677691676276.png

CRichwine_1-1677691699548.png


1 Accepted Solution

Avatar

Correct answer by
Community Advisor

The primary difference is that "Starts With" actually limits the visualization to where your dimension is the Entry value (the first value within the visit); whereas contains will look at that value in the dimension anywhere within the user session... it could be the first page, the last page or somewhere in the middle.


So in your first chart, the value is much lower because it's limited to only the views where people started their visit... vs the second one...


Notice on the second visualization, there dimension you are looking at shows "entries" (the green bar on the left) and then the other dimensions flowing in (blue), and then the outgoing dimensions (also blue) and Exits (red).


In the first visualization, the who dimension is coloured green to indicate that this is representing the entry point to the site, and only the next flows, dimensions (blue) and Exits (red) are displayed to the right.


Even if you remove the incoming dimension column on the second visualization (so that you are only looking at the "next flows" from your dimension (so that you are looking at 2 columns of flows), it will still be representative of all the flows that got the user to that point, not just the entry.


I hope that made sense....

View solution in original post

1 Reply

Avatar

Correct answer by
Community Advisor

The primary difference is that "Starts With" actually limits the visualization to where your dimension is the Entry value (the first value within the visit); whereas contains will look at that value in the dimension anywhere within the user session... it could be the first page, the last page or somewhere in the middle.


So in your first chart, the value is much lower because it's limited to only the views where people started their visit... vs the second one...


Notice on the second visualization, there dimension you are looking at shows "entries" (the green bar on the left) and then the other dimensions flowing in (blue), and then the outgoing dimensions (also blue) and Exits (red).


In the first visualization, the who dimension is coloured green to indicate that this is representing the entry point to the site, and only the next flows, dimensions (blue) and Exits (red) are displayed to the right.


Even if you remove the incoming dimension column on the second visualization (so that you are only looking at the "next flows" from your dimension (so that you are looking at 2 columns of flows), it will still be representative of all the flows that got the user to that point, not just the entry.


I hope that made sense....