Expand my Community achievements bar.

Join us at Adobe Summit 2024 for the Coffee Break Q&A Live series, a unique opportunity to network with and learn from expert users, the Adobe product team, and Adobe partners in a small group, 30 minute AMA conversations.
SOLVED

Breakdown a traffic variable or conversion by visit metric

Avatar

Level 2

I would like to breakdown a variable by visit so I can see trended stats. For example, visits to a particular page name over time.. At the moment, the only metric available is time spent per visit. Where in admin do I go to update this?

Thanks 

1 Accepted Solution

Avatar

Correct answer by
Level 10

Hi Nick , 

The solution will also work for tracking code report. The only thing that needs to be done for displaying the actual visit figure is to select Numbers tab instead of Percentages on the Configure Graph tab on the tracking code report.Please refer the attached snapshot for more details.

Thanks & Regards

Parit Mittal

View solution in original post

3 Replies

Avatar

Level 10

Hi Nick,

For the use case mentioned above, you can just go to the corresponding report on the Adobe Analytic interface and select the metric that needs to be trended and then choose the Report type as " Trended". Example ,  Visits to a particular page name over time , you need to follow the following steps-

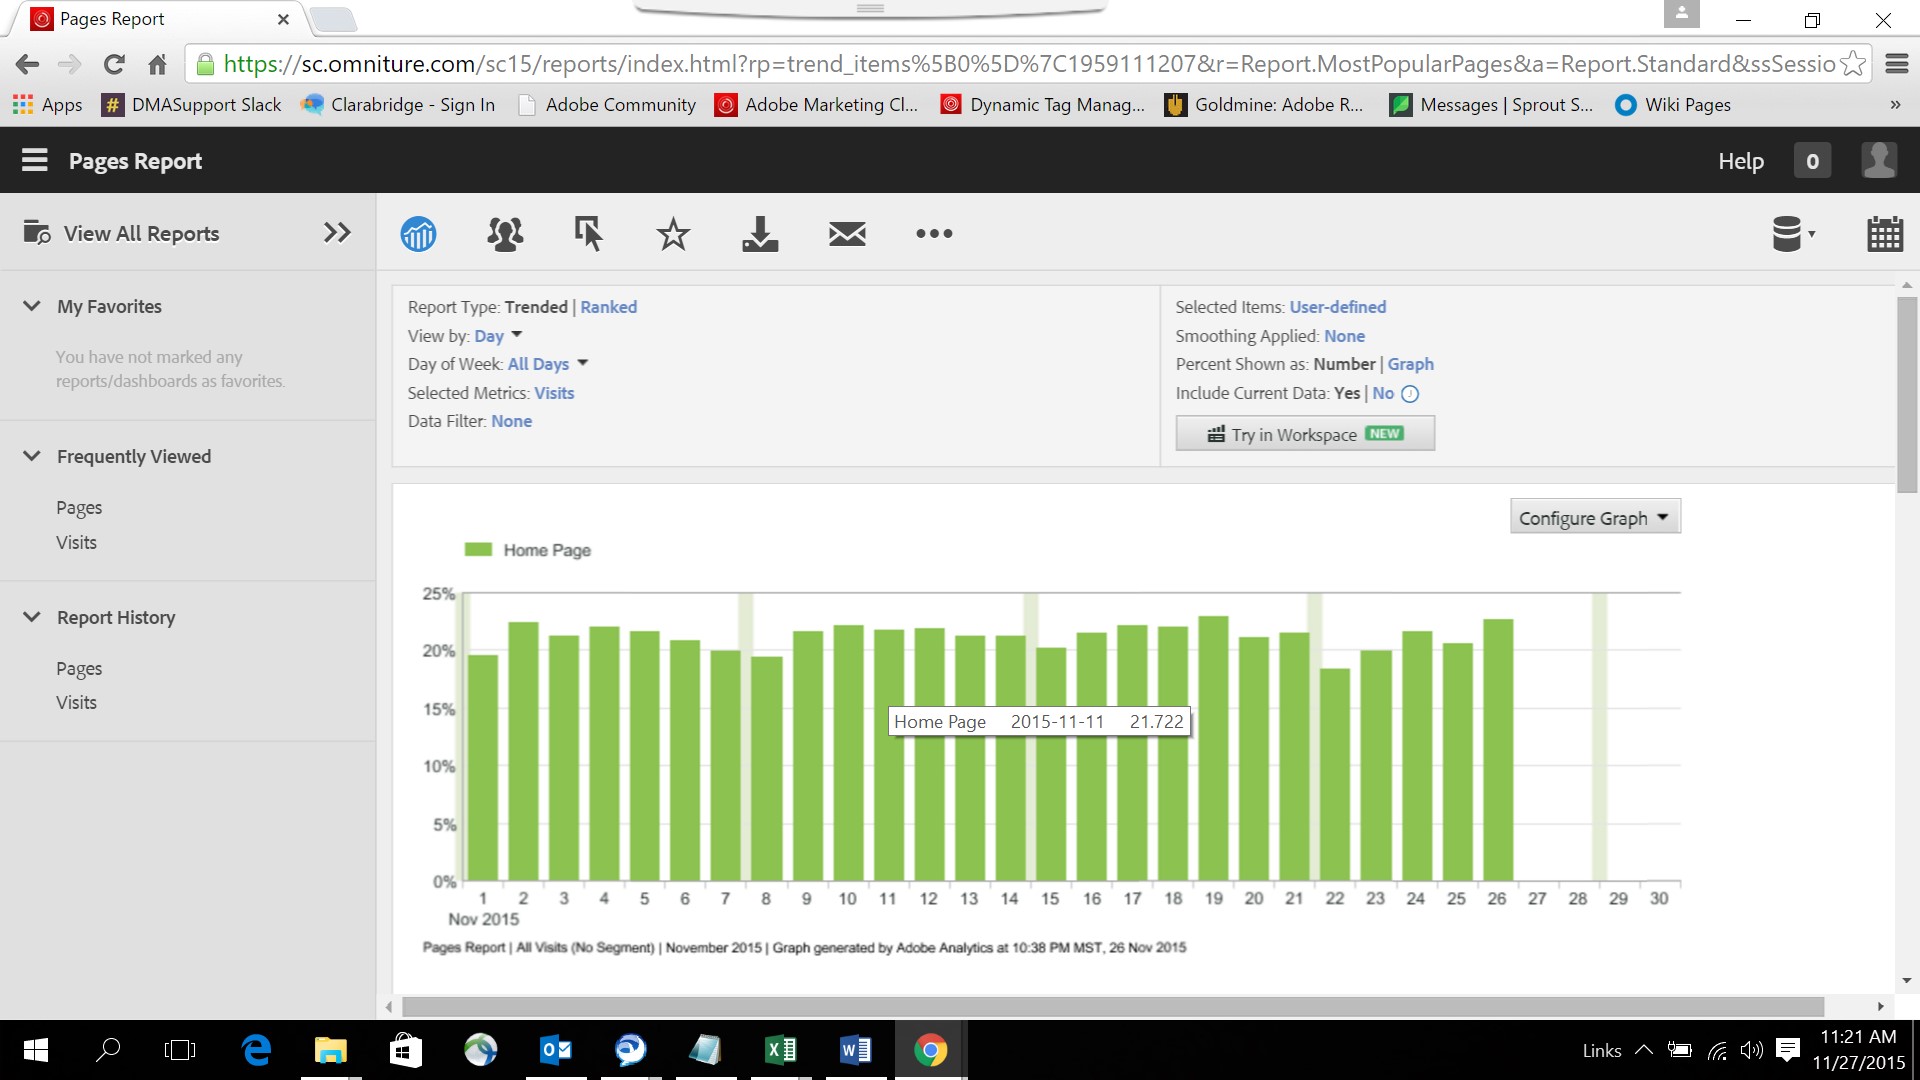
1. Go to the Pages Report Site Content---> Pages reports.

2. Select the Metric as "Visits".

3. Choose the Report type as "Trended"

4. Choose a particular page using Selected Items in the upper right corner of the report  and then select  a particular page say "Home Page".

Please let us know if you have any questions. Also, refer the attached snapshot for more details.

Thanks & Regards

Parit Mittal

Avatar

Level 2

Well that didn't work for tracking codes. I selected the code under "selected items"  and chose the metric of visit. 

The chart is displaying % of visits, not the actual visit figure....

Please advise.

Avatar

Correct answer by
Level 10

Hi Nick , 

The solution will also work for tracking code report. The only thing that needs to be done for displaying the actual visit figure is to select Numbers tab instead of Percentages on the Configure Graph tab on the tracking code report.Please refer the attached snapshot for more details.

Thanks & Regards

Parit Mittal