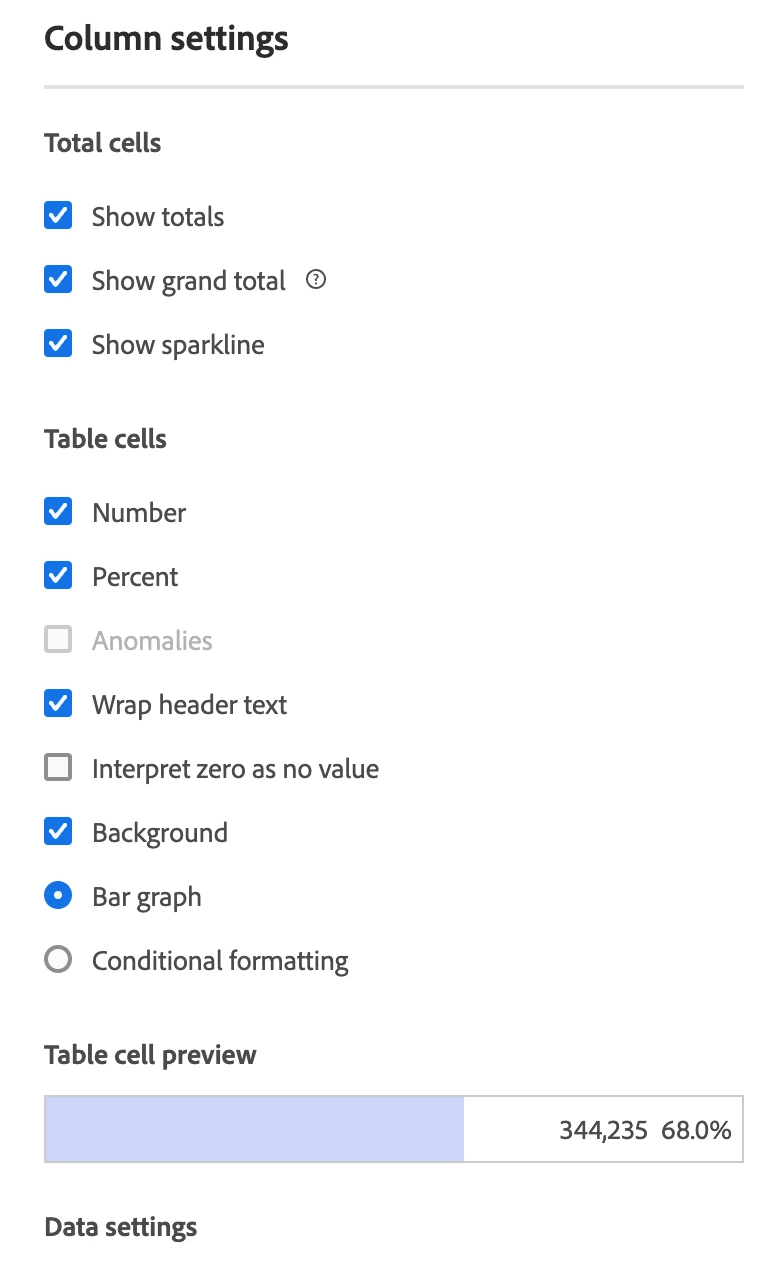
Re-enable anomaly option for trended metrics
Description -
When right clicking and trending a metric, please offer the ability to search for anomalies on the trended metric.
Why is this feature important to you -
Before changes to anomaly detection a few months ago, this was available. Now it takes several steps to replicate. Re-enabling this would make it much easier to drill down into various dimensions to spot key drivers for anomalies and investigating changes in traffic.
How would you like the feature to work -
For any trended data visualization, enable the Anomalies option.
Current Behavior -
When selecting a value and trending, the Anomalies option is greyed out. For example, last 30 days by marketing channel. Selecting top channel value, right clicking and selecting trend. The line chart is displayed and the chart has show anomalies checked, but anomalies are not calculated. Clicking on the freeform table, the Anomalies option is greyed out since there's no time metric in the breakout.
As a workaround, I can find the channel(s) that I'm interested in, drop as filters under the metric, then replaced channels with day, select the column(s) and enable anomalies. However, when reviewing several anomalies or investigating traffic this is inefficient.


