
Tuesday Tech Bytes - Adobe Analytics - Week 4 - Golden Nuggets
Real-Time Report:
Real-time reporting showcases the traffic for the active visits on the site and ranks the dimensions. This real-time view helps to make decisions on changing circumstances of the performance, campaigns and respond to the changes quickly.
Configuring Real-Time Reports:
Navigation: Analytics > Admin > Report Suites > Select a Report Suite > Edit Settings > Real-Time > Save or Save and View Report
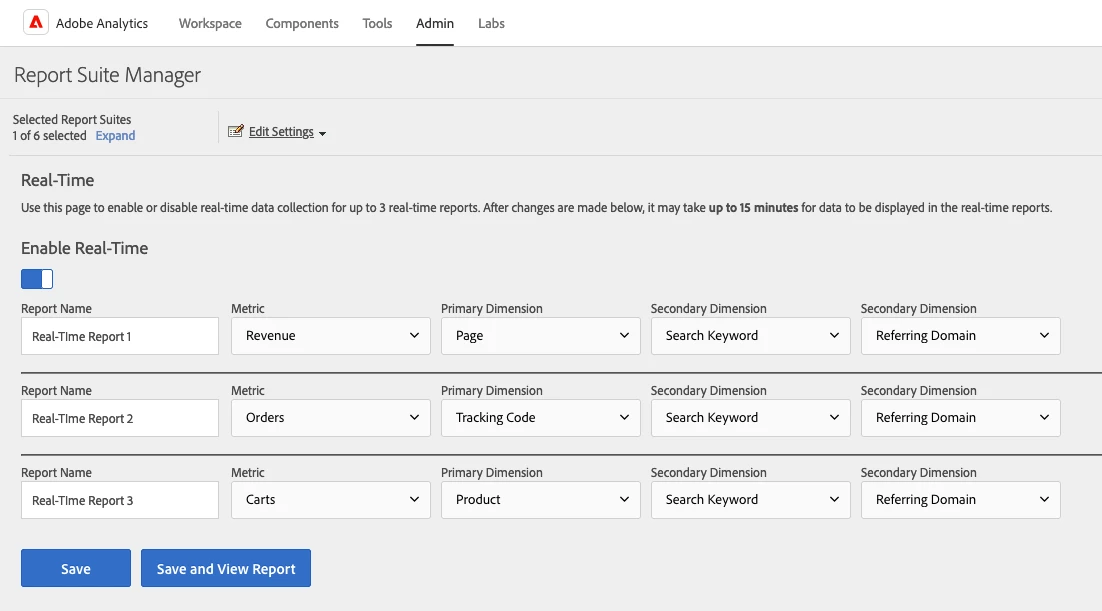
- Enable Real-Time toggle to enable the real-time reports.
- You can create up to 3 real-time reports.
- You can add 1 metric, 1 primary dimension and 2 secondary dimensions per report.
- There are only few metrics and dimensions are supported in real-time reports.
- The selected dimensions should be unique.
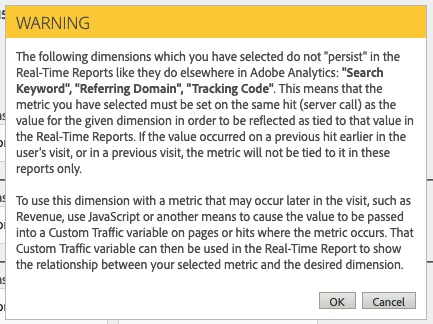
- Some dimensions do not persist in real-time, if you select a non-persistent metric, you will see the below warning
- eVars are not supported in real-time reports.
- If you have created classifications, they will appear under the defined dimension.
- Once the report is setup, it will take about 30 minutes to populate the data in workspace.
- Only Admins can setup or modify the real-time reports.
- All users will have access to the real-time reports by default.
Supported Metrics and Dimensions in Real-Time Reports:
Metrics:
- Revenue
- Orders
- Units
- Carts
- Cart Views
- Checkouts
- Cart Additions
- Cart Removals
- Instances
- Custom Events
Dimensions:
- Page
- Search Keyword
- Search Engine
- Referring Domain
- Geosegmentation Country
- Geosegmentation Region
- Geosegmentation City
- Geosegmentation U.S. DMA
- Product
- Server
- Site Section
- Tracking Code
- Custom Link
- File Download
- Exit Link
- Props
Accessing Real-Time Reports:
Navigation: Analytics > Workspace > Reports > Engagement > Real-Time
- You can view up to 2 hours of real-time data with 4 timing options.
- Last 15 minutes, Last 30 minutes, Last 1 hour, Last 2 hours
- Real-Time data is reported in less than 2 minutes and auto updates every minute.
- Metric will be shown on the top with the line graph.
- Metric line graph will have comparison of Now vs Last Week vs Last Year
- Dimensions will be shown with the top 10 results of real-time.
- You can see the dimension results by Most Popular or Gainers or Losers.