
Triage in Digital Analytics: 3 Statistical Ways to Prioritise and Strategise Your Data
“We are drowning in information but starving for wisdom.” -E.O. Wilson
This rings so true in a world of big data. And it echoed strongly during the early days of my career in Digital Analytics. It’s a relief knowing that analysts don’t need to be exhaustive with data points. Else, it only gets too overwhelming, and you’ll be lost in the sea of numbers.
But the next question is, how do we even know where to start? Here are three effective ways to statistically choose your battle in data analytics.
1. Pareto Principle
Known as the 80/20 rule, this concept from economist Vilfredo Pareto explains that 20% of what you do matters, the rest is a waste of time, which is 80%. The key to success is identifying the crucial 20% of input and prioritising it.
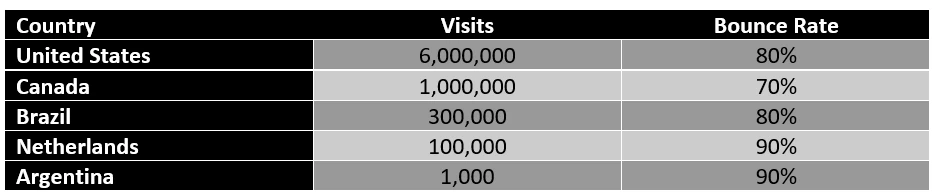
An example scenario, your Adobe Analytics dashboard shows that your campaign landing page has a bounce rate higher than your KPI of 60%, and this website is used for 50 countries.
If you'll only look at the Bounce Rate column to spot which was the highest, it will be misleading because the country with the highest bounce rate may not have significant volume of visits to dramatically decrease this website metric even after optimisations.
How to do it?
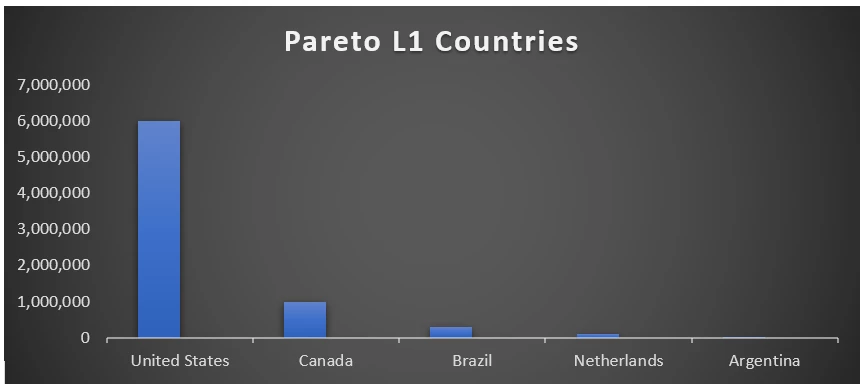
Level 1 Pareto Analysis
To know which country to prioritise, you export the website traffic and visualize. With this chart, it will be clear to your stakeholders that United States is the priority. It doesn’t mean you ignore Canada and other countries, but the one million can wait versus the six million visits.
Level 2 Pareto Analysis
To further understand which channel you must prioritise for deep dive, you drag the last touch channel dimension under United States:
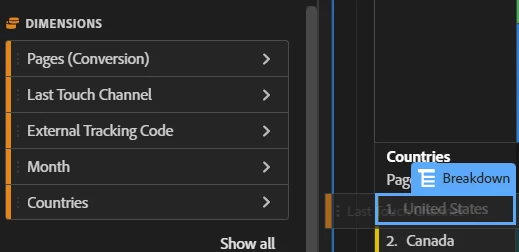
Then you can visualise as Pareto L2:
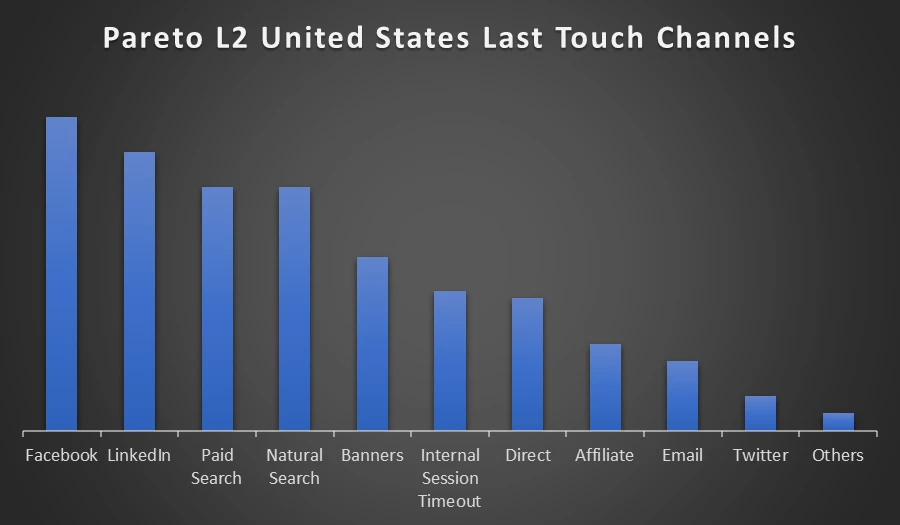
Unquestionably, you pay attention to Facebook and LinkedIn first to understand which ad is causing high bounce rate to your site. As Kruse (2016) enlightens, Pareto helps you determine what is of vital importance.
2. Andon Cord Method
Originated as a lean principle in production of manufacturing systems, Toyota introduced the Andon Cord concept to empower employees become self-sufficient problem-solvers. Consisting of a pull cord or button that workers could activate to stop the production and warn management in case of a significant issue. This way, the production line would not manufacture any faulty units while working on fixing the problem as fast as possible.
As an analyst, think of Andon as a traffic light. You rate your digital performance according to gravity and severity:
- Red- which one requires highest attention first
- Yellow- which one may be optimised
- Green- which one must keep going
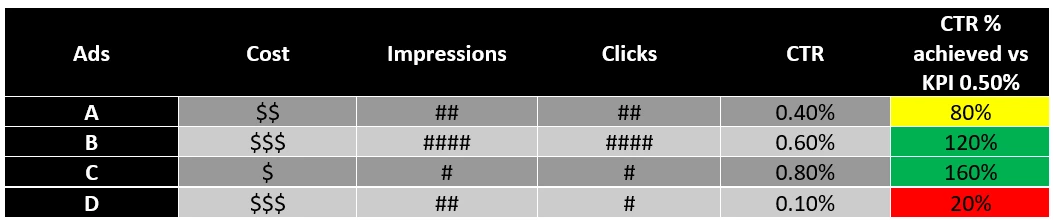
- Above shows that Ad D had the worst performance compared to your CTR KPI of 0.50%.
- Depends on your standards, but yellow rating can be between 60%-99% vs your KPI, and anything below 60% is red. You may also set a benchmark of anything below 80% is red.
- With the guidance of Andon Method to your digital analytics, you may recommend stopping Ad D and shift more budget to Ad C; and Ad A needs to be optimised to improve the CTR from 0.40%.
3. Correlation Coefficient
Lastly, when key factors are unclear affecting your performance analytics such as nuances in attribution, correlation analysis will be useful. If you have multiple dimensions to connect and analyse in parallel, correlation coefficient will support which has the highest positive or negative value.
For instance, this will help decipher which last touch channel has more linear relationship with internal sessions timeout.
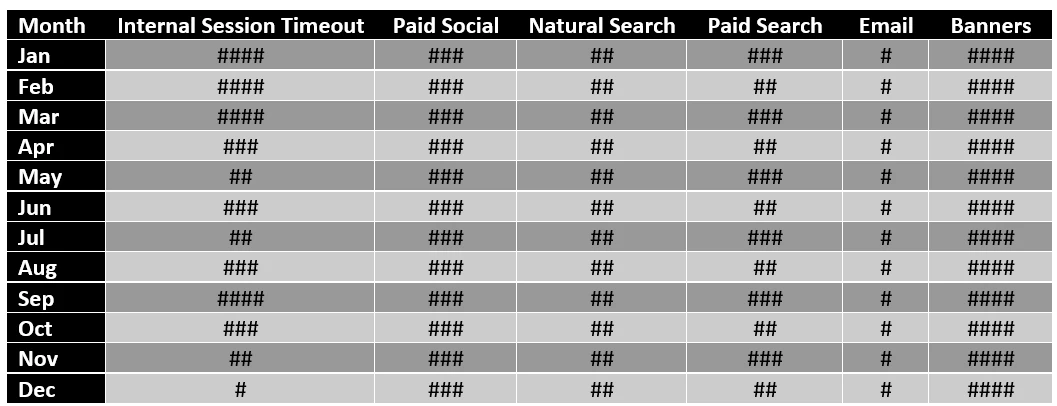
Let's say from data set above, your correlation values are below:
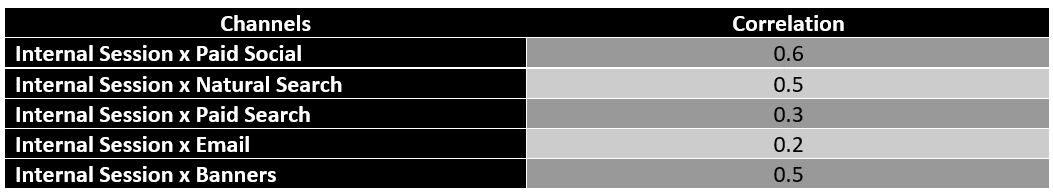
Statistically, you have strong reason to concentrate on paid social.
After applying these methods and identifying your priorities, I do not suggest ignoring the rest especially if it is detrimental to campaign success and business outcomes.
What should you do with the ones less critical? You either deprioritise, or simply let it go.