
Correlation and Attribution: Data Analytics to Decipher the Nuances of Internal Session Timeout, and Direct Traffic
High internal sessions timeout is certainly not the kind of web analytics that you want to report to your business stakeholders. Aside from its vagueness to represent your paid digital marketing efforts, it doesn’t indicate which channel has the most impact. Despite analysts’ best efforts in tracking performance, some may fall in the cracks with the nuances of internal session timeout and direct traffic.
As Salesforce noted in 2019, an average customer uses 10 channels to communicate with companies, which means the digital marketing landscape is more fragmented than ever. Therefore, Adobe Analytics comes handy in the performance marketing challenge of attribution.
A solution that has helped me decipher this was a correlation analysis of website monthly visits using last touch channels.
1. Correlation Analysis of Last Touch Channels
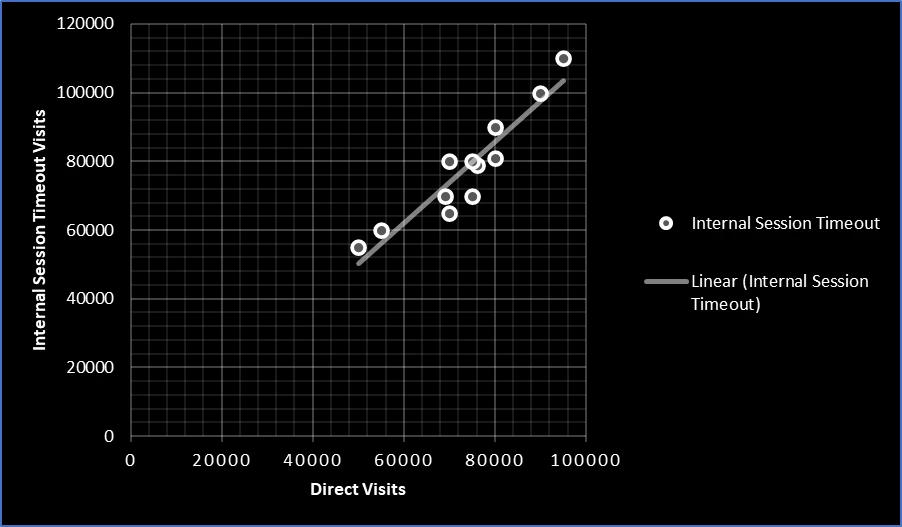
a. Internal Session Timeout and Direct Traffic Has Correlation Above 0.05 Level of Significance
This outcome may be expected since both last touch channel are apparently both ‘Direct’ without tracking code or prior channel as a source. The next question then is which channel has the highest correlation with Direct Traffic?
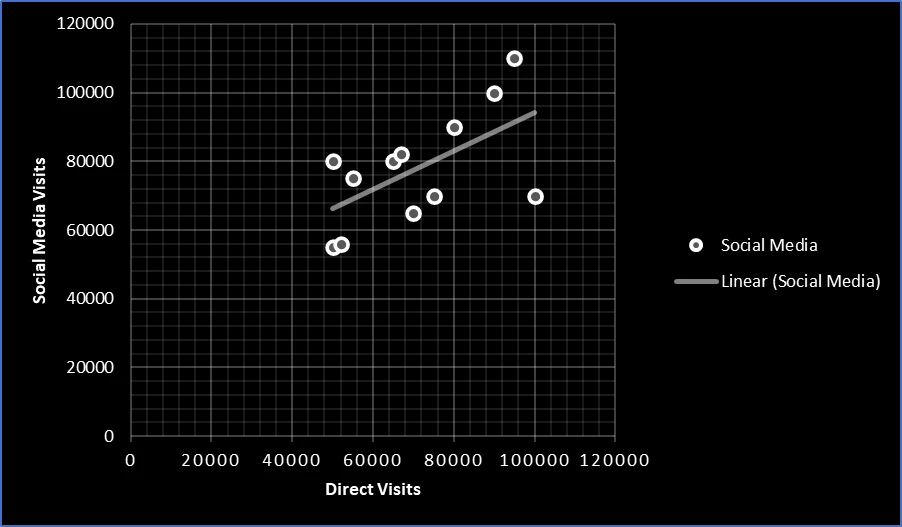
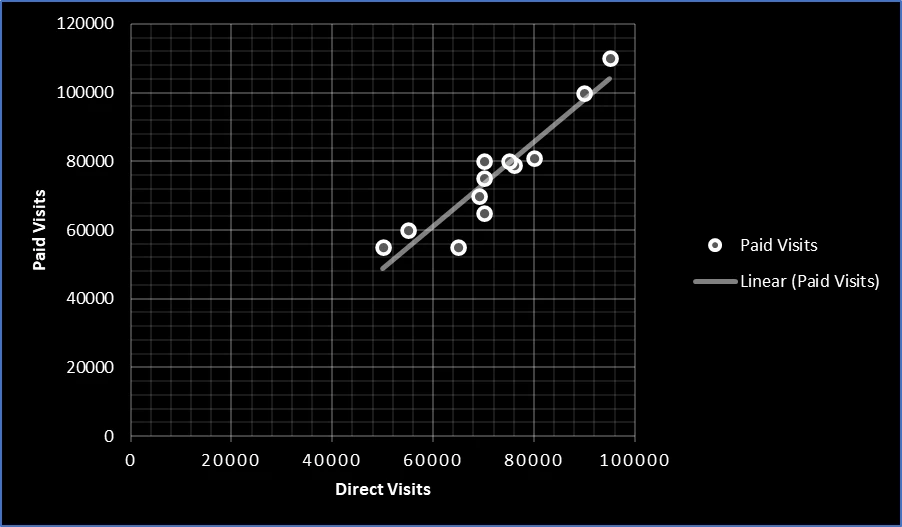
b. Direct Traffic and Paid Social Media Traffic Has Correlation Above 0.05 Level of Significance
This result though has slightly lower correlation value compared with Internal Session Timeout Visits and Direct Visits, it is still significant to infer that the more traffic from one channel, the higher the traffic from the other channel.
You may wonder what if you are not looking at a whole year data so you may not deduce an accurate correlation. I recommend using weekly visits especially when you are investigating for a specific campaign. Understanding that a campaign may have been activated in phases, hence, a monthly correlation analysis may not be reflective.
Another useful Adobe Analytics segment that you can drag and drop to your table are return or repeated visits.
2. Correlation Analysis of Return Visits
This comparison will help magnify whether the more audiences revisit the website from one channel such as paid social media, is there a correlation of higher returning visits from another source such as Direct Traffic.
In the example above, I’ve combined the return visits from all paid channels such as Social Media and Paid Search, and correlated it with Direct Traffic. The correlation value was very strong.
In a Salesforce State of Marketing Research, 41% of marketing organizations are using marketing attribution as a measure of ROI. Analytics tells us the ecosystem of a customers’ website journey and its interrelatedness towards campaign success. One channel doesn’t operate in isolation, nor one is greater than the other.
In the world of performance marketing, correct attribution is ideal. But with Internal Sessions and Direct Traffic that tell only half of the story, a deep dive to explicate the customer journey will simplify this and aid in the decision-making process.
Regardless which marketing attribution model your company subscribes to, what is clear from above examples is that continuous nurturing though paid channels increases the likelihood of visitors discovering your website through organic channels, and returning, consequently converting and/or taking high engagement actions.