Transitioning from Reports & Analytics to Adobe Workspace
On January 4, 2022, Adobe announced plans to end-of-life Reports & Analytics, as well as the SiteCatalyst point-product. The Reports & Analytics functionality and capabilities have been moved to Analysis Workspace and a threshold of workflow parity has been reached.
The purpose of this post is to help you identify the assets that your organization is currently using within Reports & Analytics (R&A) and provide guidance for how to transition to Adobe Workspace.
Here’s a list of what is covered in this post:
- Identifying R&A Assets for Transition to Workspace
- R&A Dashboards and Bookmarks
- Real-Time Reports
- Calendar Events – “Annotations” in Workspace
- Scheduled Reports
- Publishing Lists
- Other Features
Identifying R&A Assets for Transition to Workspace
A list of all Reports & Analytics assets that should be considered for the Workspace transition can be obtained through Logs. Within Adobe Analytics navigate to Admin > Logs > Usage & Access Logs.
Key Callouts:
- Logs can only look back 3 months at a time, so you’ll have to run multiple reports to cover a time period greater than 3 months.
- To find the R&A reports that are being used search for the following assets using the “Event Type” drop down within Logs.
- Report Viewed
- Bookmarks
- Dashboards
- Alerts
- Calendar Events
- Scheduled Reports
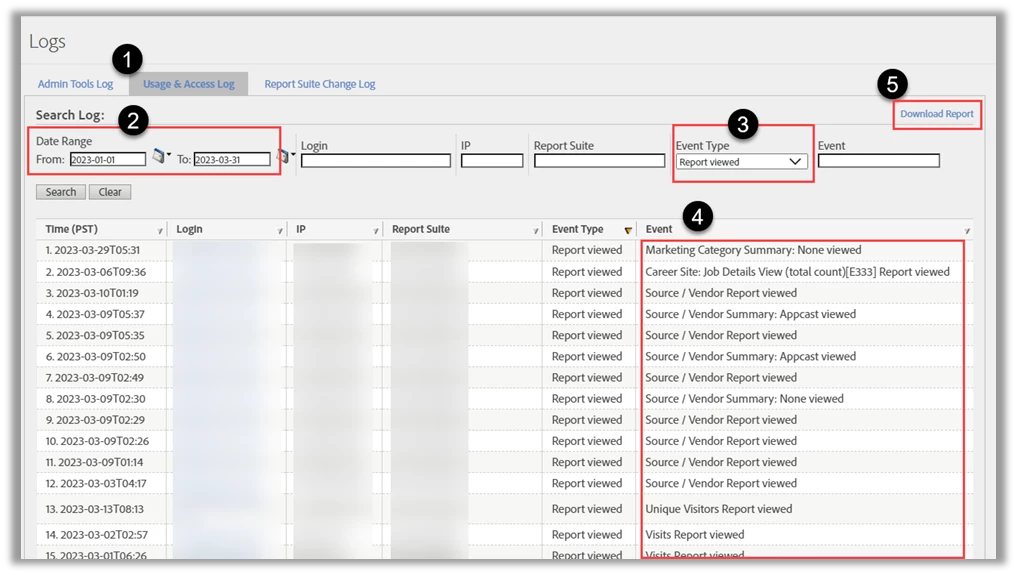
Here are the steps to running and exporting the logs.
- From the Usage & Access Log tab
- Enter your dates (not to exceed a 3-month period)
- Select your Event Type & click “Search”
- Under event, you can see the names of the assets that meet your Event Type criteria
- Click Download Report to export this information into a .csv file
Once this data is in Excel, a pivot table can be leveraged to determine a count of the unique items for each feature.
R&A Dashboards and Bookmarks
Any R&A Dashboards and Bookmarks still in use will need to be built within the Workspace UI. The first step would be to identify the Dashboards and Bookmarks that need to be built. You can do this using the steps above. The information below from the End of Life Announcement should help acquaint you with Adobe Workspace and provide instructions for how to begin building these reports.
If you are new to Analysis Workspace, we would highly recommend you taking the time to review documentation and many of our videos on Adobe’s YouTube channel to familiarize yourself with how to use Analysis Workspace.
This video is a great primer and overview of Analysis Workspace.
Also, we have created a built-in learning section directly on the Analysis Workspace landing page. Simply click on the Learning tab in the left rail to access the content. We strongly encourage going through each of the tutorials and videos to learn more about the fundamentals of Analysis Workspace.
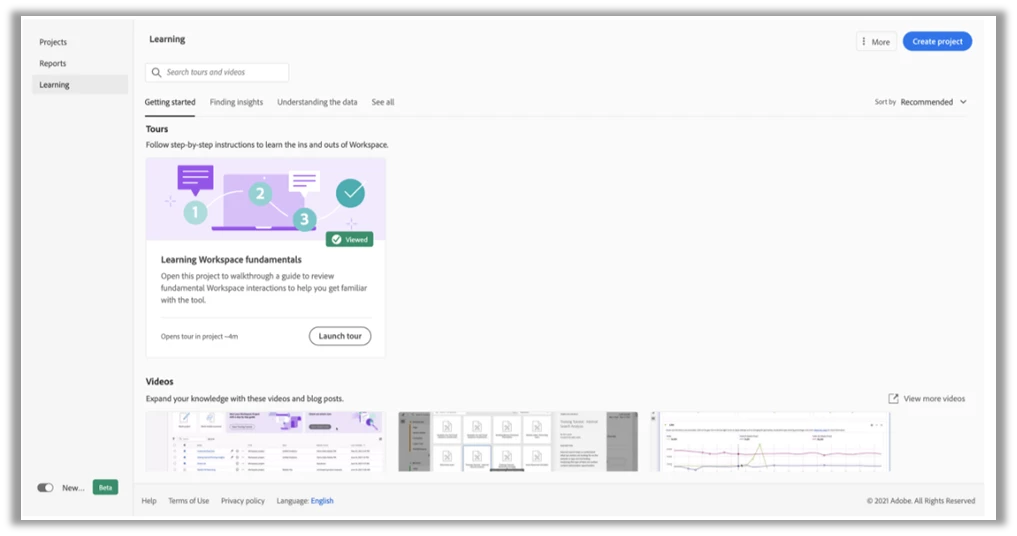
For more getting started content, this playlist on our YouTube channel has a curated selection of videos designed to help you learn more of the Analysis Workspace basics.
Other features that could be helpful in keeping track of Projects created in Workspace are Tags and Folders.
Tags
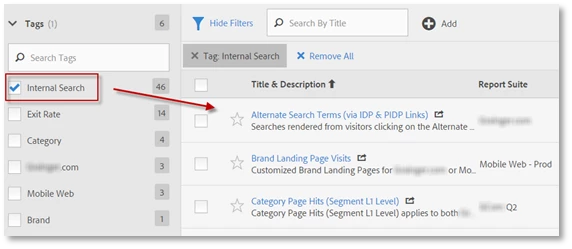
Tags are keywords or metadata that describe segments, metrics, or reports and allow them to be filters or grouped based on those tags. Adding tags to segments, metrics, or reports allows end users to locate reports/variables by performing a search. Tags can be used to find reports instead of bookmarks. Common tags can include:
- Shopping Cart
- User Identification
- Global Approved
- Data Connectors
- Marketing Channel
- Registration
- Mobile
Once tags have been applied, they can be accessed from the left navigation in Workspace or through the Segments manger. These tags can be searched by entering “#” in Search Components in the left navigation or by clicking a tag to filter down to the available segments in order to better find the needed segment.
Folders
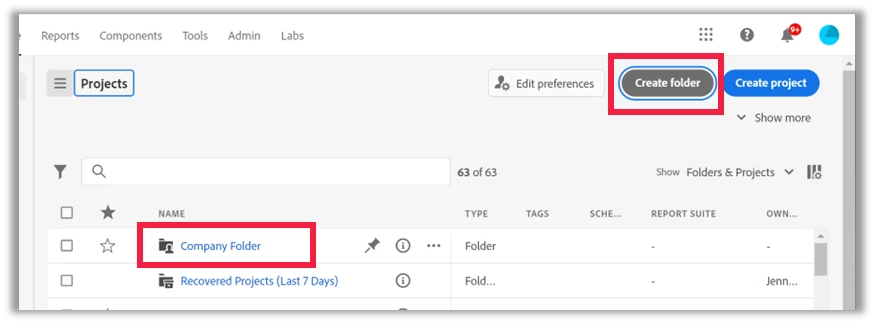
- Workspace now has a folders feature, which creates folders and sub-folders to manage your projects, making it easier to find and group projects when you need them.
- Company folder allows Admins to easily create and share content with all Workspace users.
- There are also Personal folders that individual users can create to organize their Workspace projects.
Reporting
Analysis Workspace provides many of the same Reports & Analytics reports out of the box. They can be accessed from the Workspace landing page by clicking on the Reports tab. They can then be browsed using the menu or searching for them by title in the search bar at the top.
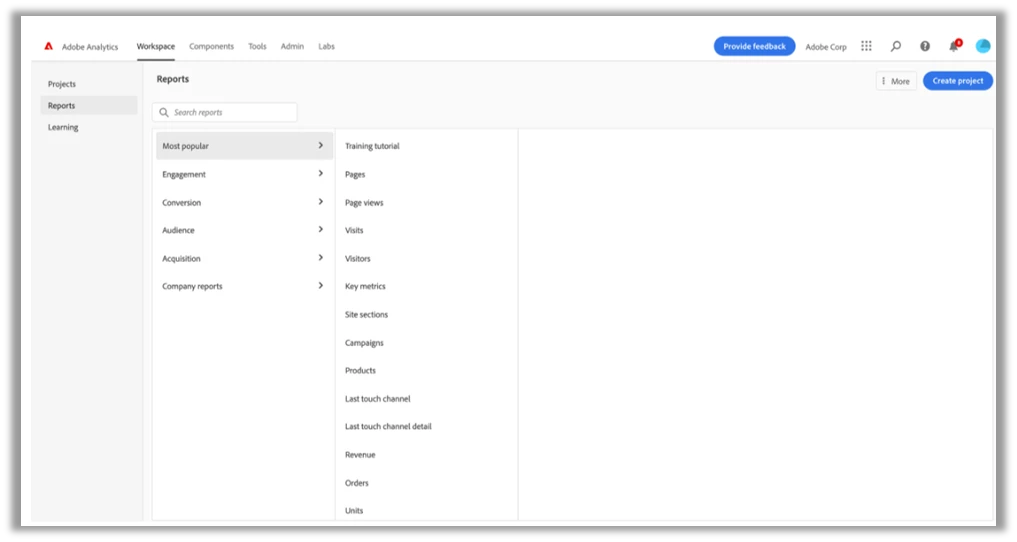
All of the data used in Reports & Analytics is available in the same report suite within Analysis Workspace. As a result, the majority of the reports and dashboards used in Reports & Analytics can be recreated as a custom project in Analysis Workspace.
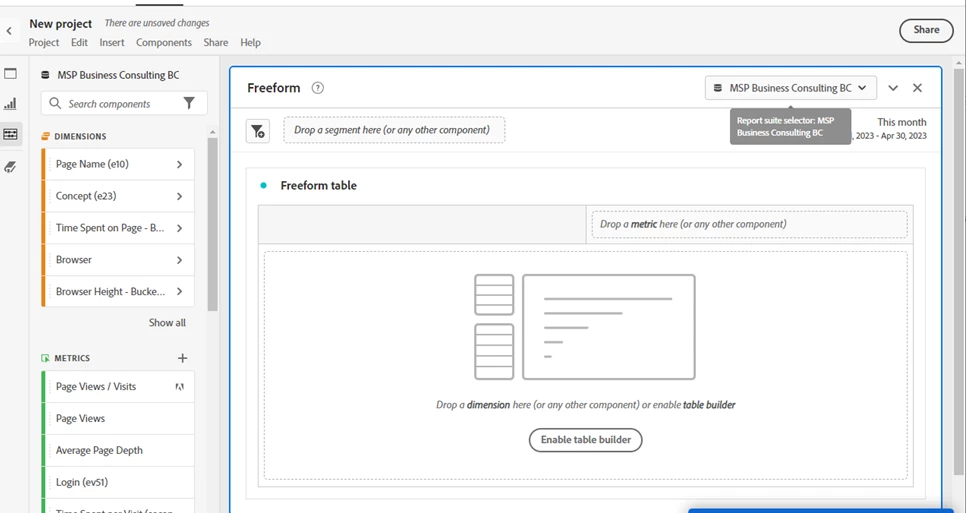
To do so, open a blank project from the Workspace landing page. The data in Workspace is categorized into various component types: Dimensions, Metrics, Segments and Date Ranges. All your eVars and Props are captured as dimensions and are available within the appropriate report suite.
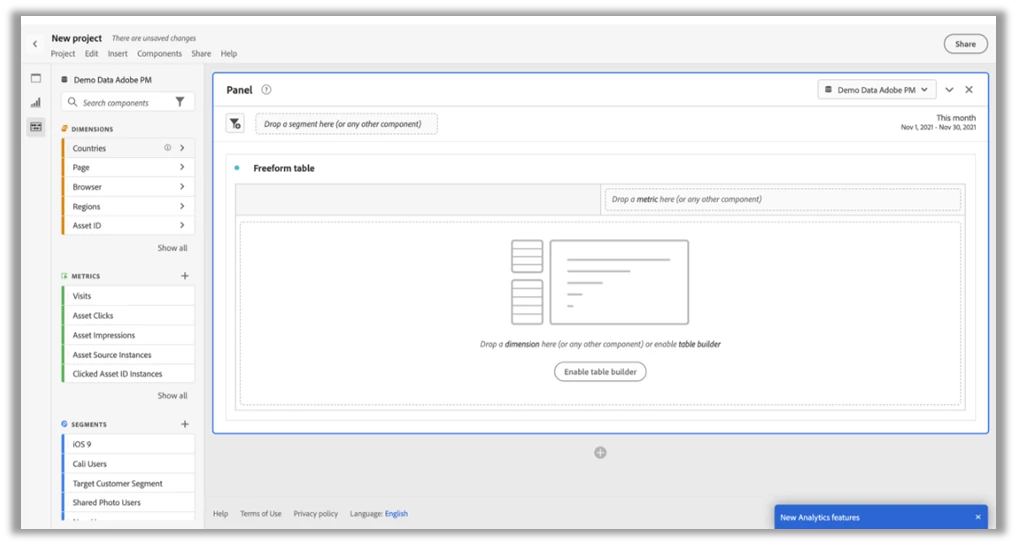
Once a blank project is open, search for the applicable component in the left rail and drag it onto the blank freeform table canvas. It will begin to auto-build for you but is fully customizable. Dimensions typically go on the left (as rows) and metrics go across the top (as columns). Segments can be applied directly on the columns in the table or in the header of the project and will filter the corresponding data accordingly.
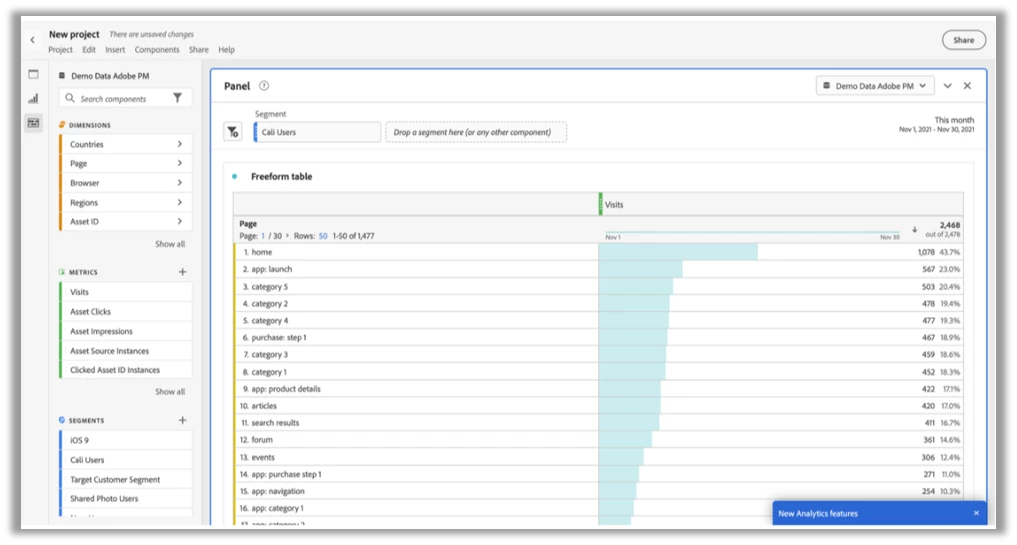
For anyone wanting additional guidance and support, this video walks you through how to build a project from scratch in Analysis Workspace.
If you are new to Analysis Workspace, we highly recommend completing the Training Tutorial which is designed to help users familiarize themselves with the Workspace patterns and structures for analysis and reporting. It can be accessed directly from the Analysis Workspace Landing Page within the purple hero banner across the top.
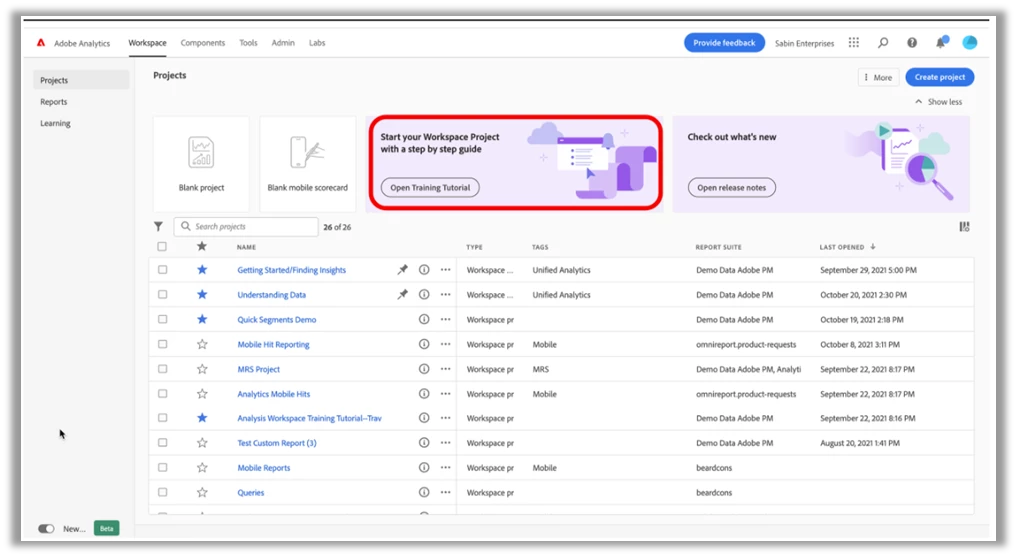
Additionally, we have created a video that walks you through how to use the Training Tutorial if you get stuck or need additional guidance.
Real-Time Reports
Real-Time Reports have recently been added to Workspace and can be found by following these steps.
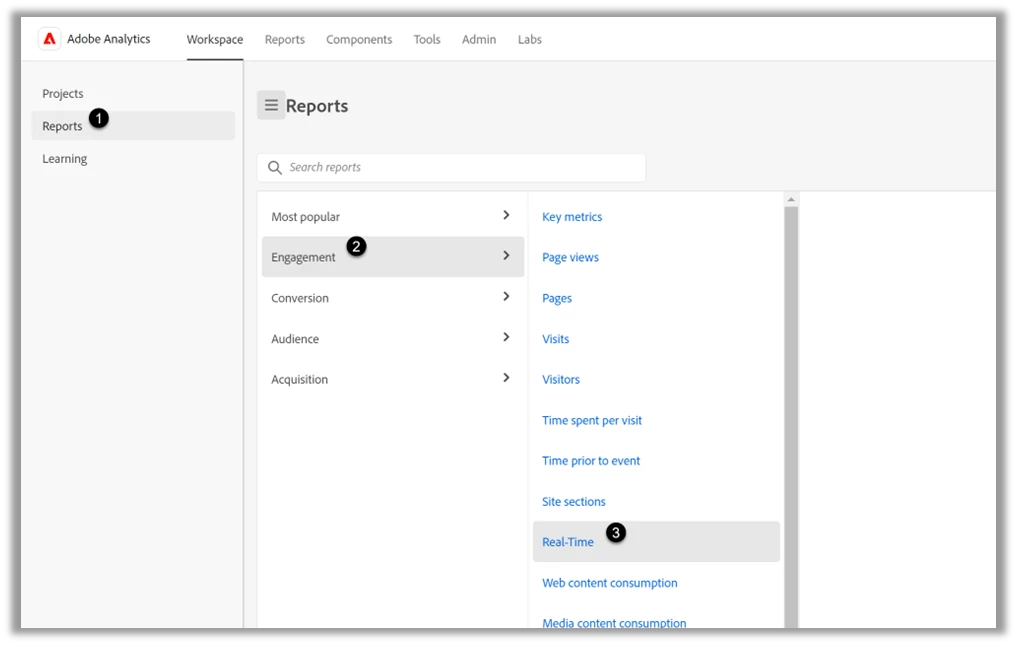
From the Workspace tab
- Select Reports
- Select Engagements
- Select Real-Time
Calendar Events – “Annotations” in Workspace
Important calendar events will need to be recreated in Workspace using Annotations. See the links below for information on using Annotations.
Scheduled Reports
Effective January 31, 2023, only existing scheduled R&A reports can be reactivated and/or sent.
If a report or dashboard is scheduled for delivery from Reports & Analytics, we recommend you take the following steps to re-start the schedule in Analysis Workspace:
- Recreate your Reports & Analytics report in Analysis Workspace
- In Reports & Analytics, cancel your scheduled report
- In Analysis Workspace, open your project and go to Share > Send File on Schedule and customize your delivery schedule as needed
Publishing Lists
One of the features in R&A that is slated to reach end-of-life on the Dec 31, 2023 date is Publishing Lists. They will be deprecated when R&A reaches its end-of-life; you will not be able to create new or access existing Publishing Lists to send or schedule Analysis Workspace projects.
To mitigate any disruption to your current report-distribution workflows that rely on Publishing Lists, we request that you consider the following alternatives:
To find out if publishing lists are currently being used in your organization go to Admin>User Management>Publishing List Manager. If lists have been created, you will see them on that page.
If you are using Publishing Lists to distribute the same version of the report to multiple users (without applying report suite overrides):
Once you recreate your reports in Analysis Workspace as projects, you can use a combination of a contact group or distribution list created for your mail client and Workspace’s Scheduled Projects feature to send or schedule the recurring delivery of the project; like Publishing Lists, a PDF/CSV version of the project is then sent to every email ID that is part of the group/list. You can learn more about the Scheduled Projects feature here.
If you are using Publishing Lists to distribute multiple versions of the report or dashboard to multiple users (via the report suite override feature):
Analysis Workspace does not support report-suite overrides or, unlike R&A reportlets and dashboards, the ability to lock report suites when sharing or scheduling projects. To replicate the workflow, you will have to create duplicate versions of the same project by saving with a new name and a different report suite applied to each version, then use the scheduled project feature described above to have the data sent to your email group/list.
Other Features
- R&A Menu Customization
- This feature is obsolete with Workspace. R&A didn’t provide the ability to search for metrics, segments, dimensions, etc. like Workspace.
- Workspace does provide the ability to use tags and folders to organize Projects.
- Next/Previous Page Reports: Released April 2022
- Page Summary Report: Released April 2022
- Combo Charts: October 2022
- Bots: Summer 2023
- For a comprehensive list of features that will be deprecated see the End of Life Announcement.
Here are other resources that you may find helpful as you transition to Adobe Workspace:
Reports & Analytics End of Life Announcement from Adobe Product Team
Analysis Workspace Documentation
YouTube Getting Started Playlist
This post was written by Jennifer Kraft (jkraft@adobe.com) and Ryan Logas (rlogas@adobe.com).

