
3 Ways to Demystify Missing Website Clicks in Digital Analytics
“Why do my landing page views or website clicks on Facebook or other channels don't match with my Adobe Analytics data?”
This is one of the most asked questions when it comes to analytics and attribution. And the answer? It NEVER would.
Before we dive into that, I want to establish the difference between website entries and visits. Imagine your landing page as a house, the entries are those who entered through the front door; while visits include those who came from the windows, fell from the roof, brought by the wind through the back door, and any other portal.

Entries are typically lower than visits. Though the difference is not massive, I recommend entries for campaign-specific insights, and future reference or benchmarking which we will need in discovering these mysteries in digital analytics.
Why Use Entries vs Visits? I believe the entry metric is a more objective measurement of a landing page’s performance. It represents how many entered the front door directly from your digital campaign, and not from other web pages that may have been brought in from other concurrent campaigns.
The factors below will not avoid horrors in digital analytics but will prepare you to understand some of the mysteries and disappearance of website clicks that didn’t register as an entry in your Adobe workspace.
1. Native Platform Report is Estimated
Facebook defines landing page views as the number of times a person clicked on an ad link and then successfully loaded the destination webpage or Instant Experience. This requires a Meta pixel installed in your website, of course. But take note that Facebook was also explicit that in some cases, this metric may be in development and estimated.
So, the first factor is that Facebook dashboard numbers are estimated. The same applies with LinkedIn, Twitter, or other ad serving platforms.
 2. Cookie Policy
The second reason for this difference is the cookie policy. This is especially true for the EU and other countries that are compliant with The General Data Protection Regulation (GDPR), cookies are used to identify users, qualify as personal data and are therefore subject to the GDPR.
Simply put, if users opted out or rejected the use of cookies, your website analytics will track lesser number of entries than what’s reported from Facebook or other channels.
3. Baseline Website Entry Rate
In line with the first factor, this is another reason why I prefer to stick with entries than visits. It is good to have a baseline on how much is the typical proportion of users who entered your landing page from any platform.
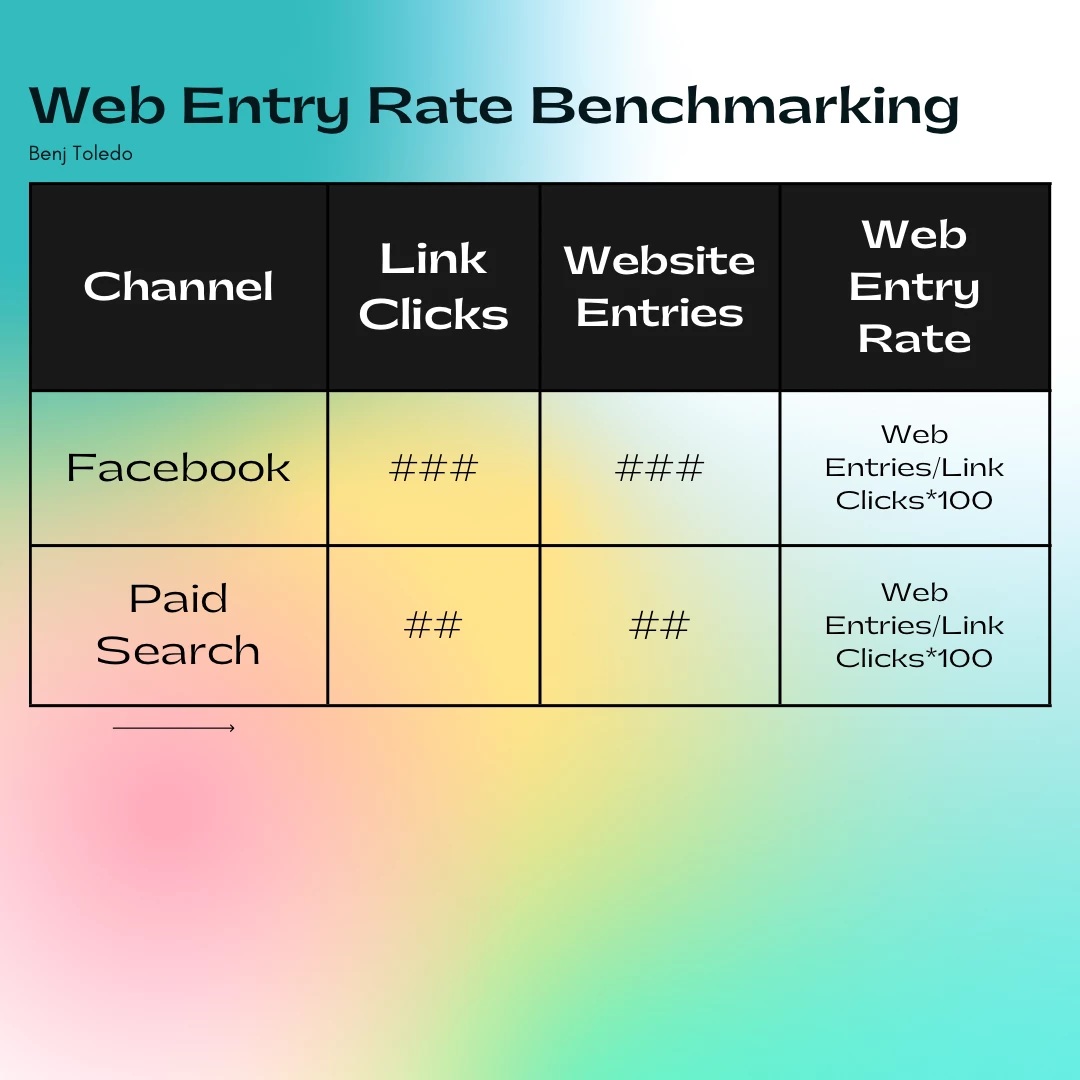
For example, your digital campaign received a total 100 link clicks from Facebook, yet the website entries reported was only 50, this means that only 50% of users successfully reached your site. This rate may differ per channel, audience, and phase of the campaign.
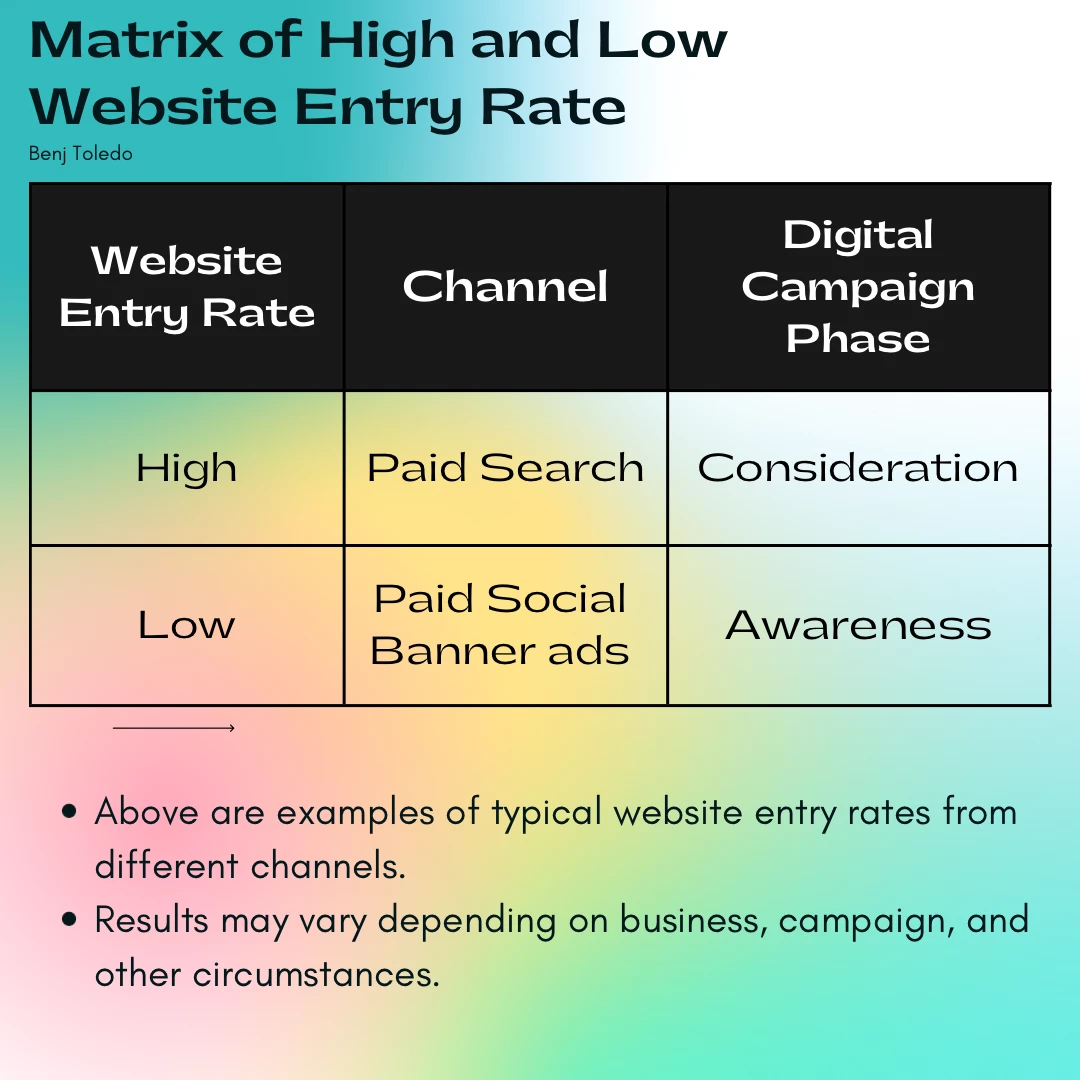
In terms of channel, usually paid social has a lower website entry rate than paid search. This is due to the nature of the platform. The audience’s intent and stage of buying cycle varies per media—paid search is user-initiated, which means that they were actively searching for information. But for paid social, audiences were passive recipients of information.
Regarding the digital campaign phase, consideration typically has a higher website entry rate than awareness. This is expected due to the customer decision journey process; those who have just seen your ads in the past three days are more likely to close the browser even before it fully loads, compared with users who have been seeing your ads for the past three weeks.
Below is an example benchmarking exercise for website entry rate. With this analytics data, you’ll no longer be terrorised when you see that your web entries are only 30% or even 20% of your link clicks. I saw some channels with only 10% or can even go as low as <5%.
Demystify your digital analytics by understanding your baseline data, channels, and audiences’ decision journey.