Thanks for trying. Yes, burndown, but all the search results and analytics examples seem to be focused on planned vs. actual hours (different columns same filter criteria).
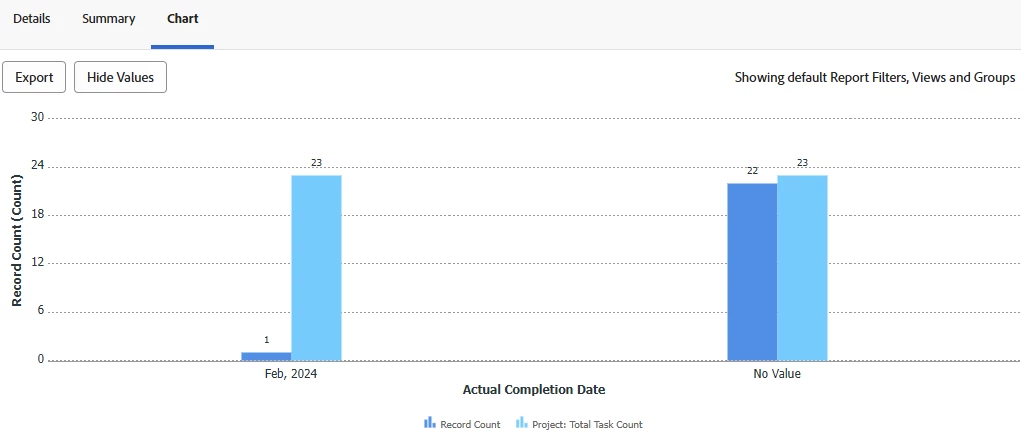
I should have mentioned that, since first posting, I have built a chart of monthly completions--see attachment. But to add the second metric (as a combination report), I cannot figure out how to give a count of tasks open in each month. The second challenge is how to use two different selection criteria or filters. For the first, it's just status = completed. But what does one do when they want another filter of status not= completed?
The problem is you can't create a chart report that will count both planned completion dates and actual completions dates into columns. There isn't a real easy way to do comparison chart report in Workfront for dates.
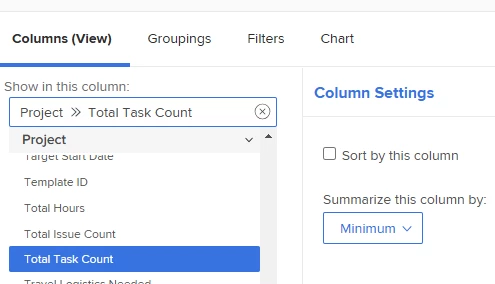
One thing I was able to do was bring in the total task count for the project. However, the total task count does include parent tasks.
Unfortunately, you can probably accomplish what you are looking for through a series of complicated calculated columns, fields, etc. but it won't happen natively.