[VIDEO] Top 3 reasons to create a Shared Column Report
Howdy folks! 🤠 Your "On-Demand Workfront CSM" @CynthiaBoon is back with another “Top 3” video!
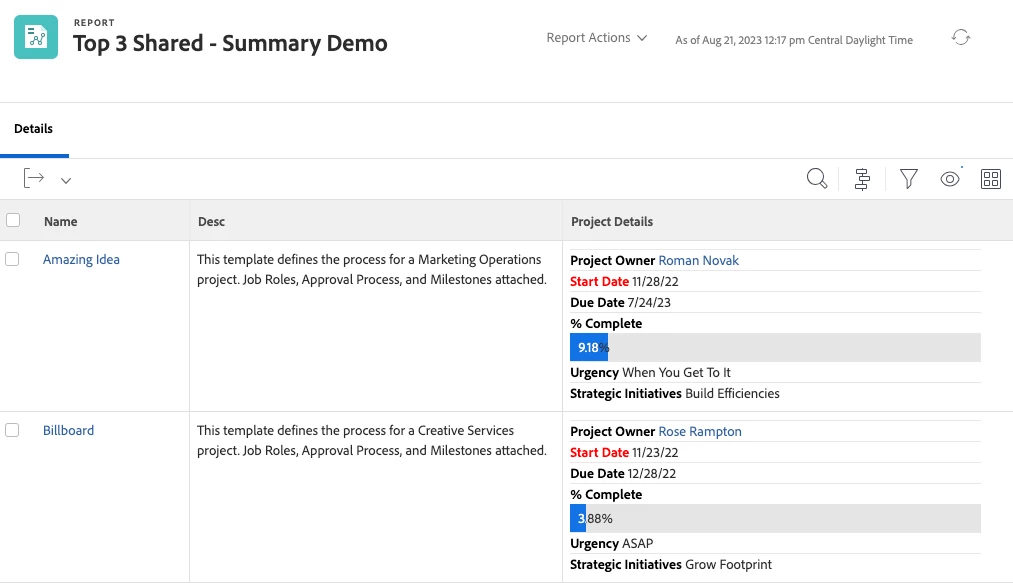
Looking for new, efficient ways to present your information in a report? Give the Shared (or Summary) Columns idea a try!
We get lots of questions on how to use Text Mode to combine information into a report, so we have a step-by-step video as well as some resources below to get you started.
First thing! As promised, here is the documentation article on how to get started with building a shared column.
View: merge information from multiple columns in one shared column
In the video, I reference some slightly different text mode than from the Experience League article (link above), so the code that I use in the demo is provided below.
📌 Pro-tip: Sometimes Text Mode doesn't copy and paste well so you may have to retype it into a reference document, but at least this is pretty short. 😏
In the video – when I talk about the "Blank" column - copy over anything that might be showing and replace it with this:
value=<br>
valueformat=HTML
width=1
sharecol=true
value=</b></font><hr><font color=000000><b> x </b></font>
In the video – when I talk about the "Workfront Object" column - just add this to the end of the existing Text Mode, without changing anything else
sharecol=true
🎁 Bonus Tip #1: To change the Display Name on the Column Name
displayname=
🎁 Bonus Tip #2: For the "Font Color" change
You can change the standard black font (Black =000000) to whatever you would like, example: Red=FF0000
🎁 Bonus Tip #3: For the "Label" change
Where the placeholder "x" is: that is where you want to put the "label" of that value, example Project Owner or Status or % Complete, etc.
NOTE: For those in the know, you probably noticed that I forgot to add a “Blank” column in front of the “Owner” column, which is why it didn’t have a label. You can always go back and add it, like I did. (Screenshot below. 😉)