
KPI Dashboards in the New Workfront Experience: Working with the Marketing KPI Dashboard Kickstart
This blog series is a converted learning path that is made up of 3 sections and does not necessarily need to be reviewed in sequential order.
Please use the following links to navigate to other blogs in this series. We recommend completing Section 1 and then at least one of the subsequent
sections - select whichever kick-start section most closely aligns with your business objective.

Overview: KPI Dashboards in the New Workfront Experience
Section 1: Introduction to KPIs
Section 2: General KPI dashboard kick-start
Section 3: Marketing KPI dashboard kick-start
Working with the marketing KPI dashboard kick-start
Your marketing team is busy crafting the public image of your company. Being able to quickly track and measure the effectiveness of the team and justify work efforts is essential.
As the system administrator, you can import and share the KPI dashboard kick-start in Workfront. You may be responsible for customizing and monitoring the dashboard, or you may simply import and share the template with project managers so they can copy and customize it to suit their teams and needs. This learning path assumes the prior. If you do not have system administrator access, reach out to your Workfront administrator for help importing the kick-start file.
The reports in this kick-start are based on feedback from hundreds of Adobe Workfront customers and are intended to help you track key performance indicators such as demand, productivity, and resource utilization. To help you get started in measuring these types of KPIs, the Marketing KPI Kick-Start is included in the resources for this learning path.
To complete this section, download the Marketing KPI Dashboard Kick-Start Import.zip file attached to this post.
Import a dashboard kick-start
- Download the Marketing KPI Dashboard Kick-Start Import.zip file attached to this post.
- Log in to Workfront, then navigate to the Setup area from the Main Menu.
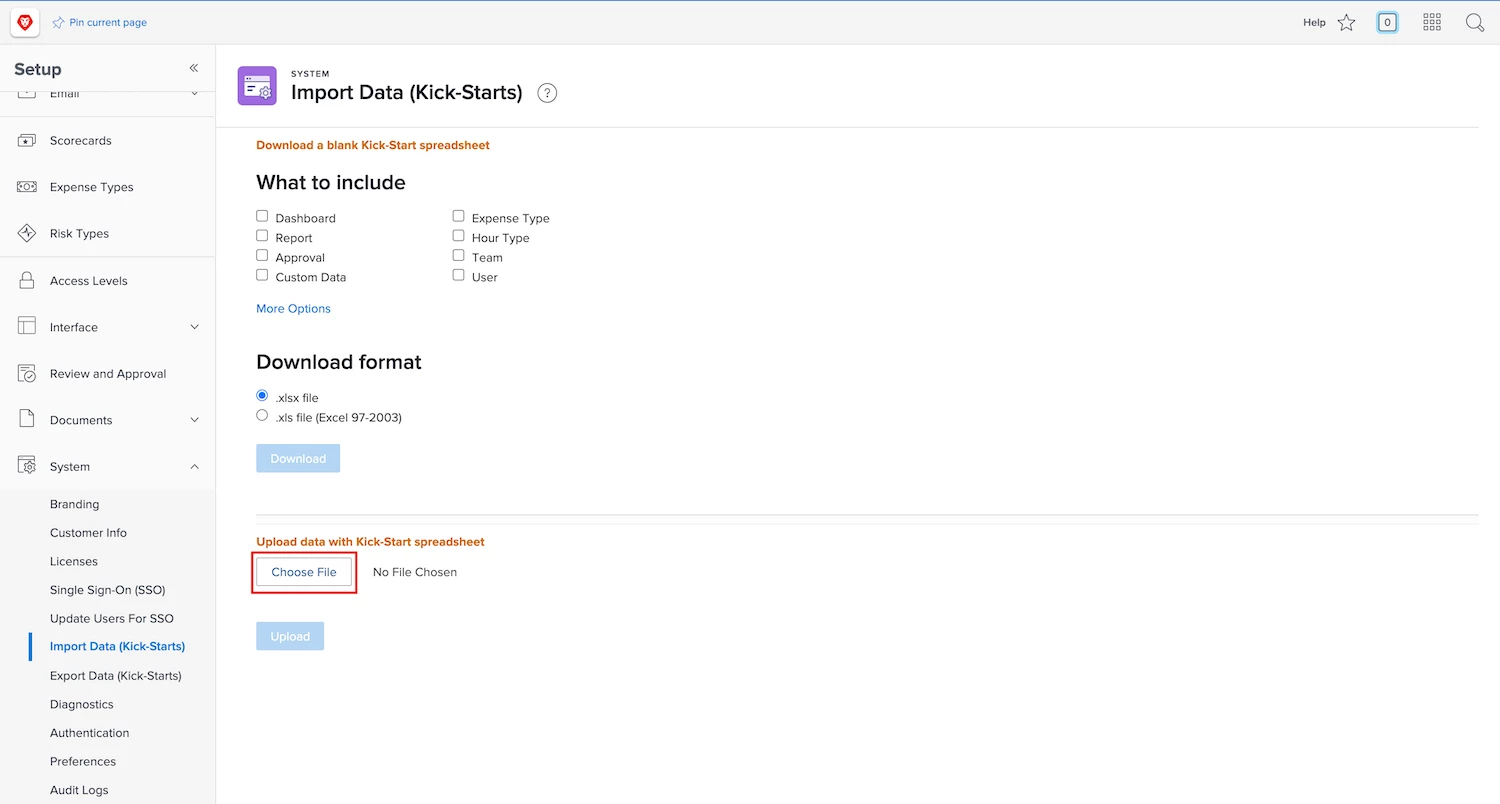
- Select Import Data (Kick-Starts) from the System section in the left panel menu.
- Click Choose File in the Upload data with Kick-Start spreadsheet section. Select the Marketing KPI Dashboard Kick-Start Import.zip file from your downloads and click Open.
- Click the Upload button.
The blank dashboard and all of the reports have been added to your system. Now you’ll associate the reports to the dashboard. Remember, not all of the reports may apply to your unique business needs.
Set up the dashboard
- Navigate to the Dashboards area from the Main Menu.
- Open the dashboard by selecting KPI Dashboard from the My Dashboards list.
- Select Edit from the Dashboard Actions drop-down menu.
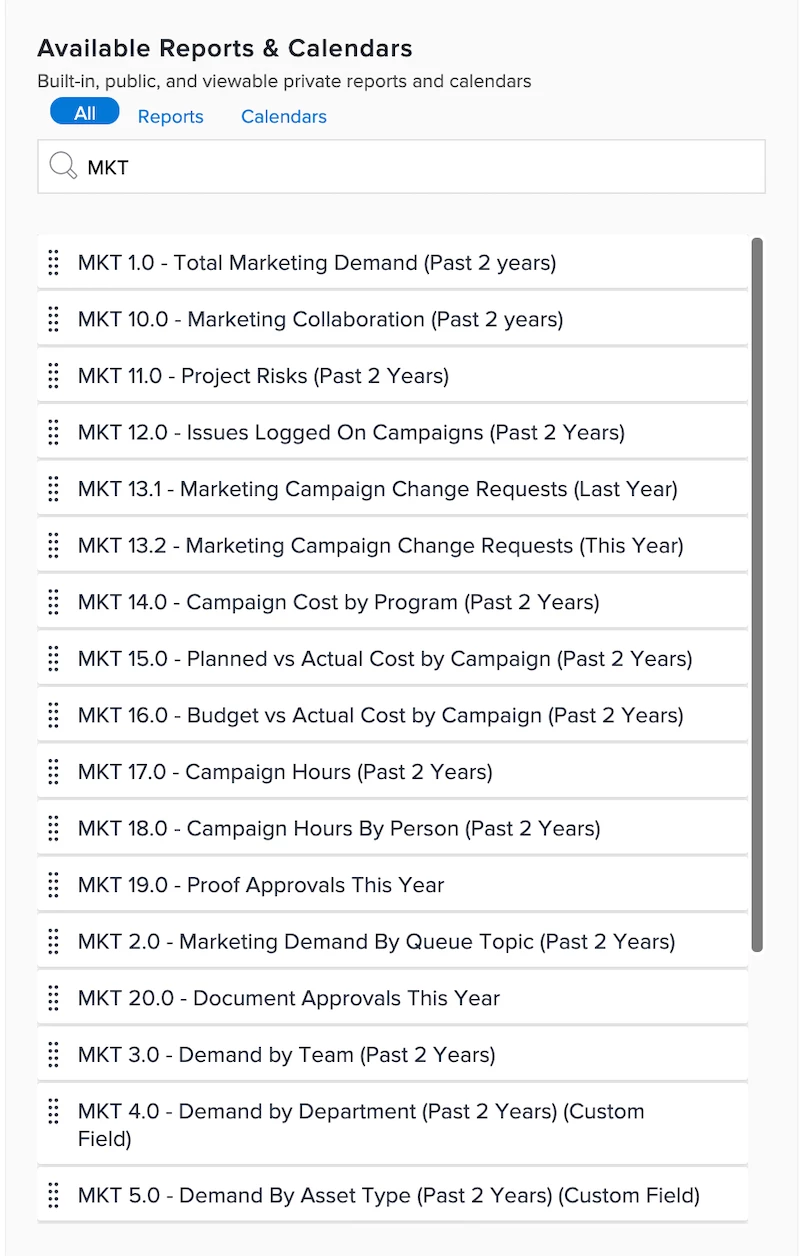
- Enter MKT in the Search by name or type field to narrow down the report list results. There are 23 reports imported from the kick-start, all beginning with MKT.
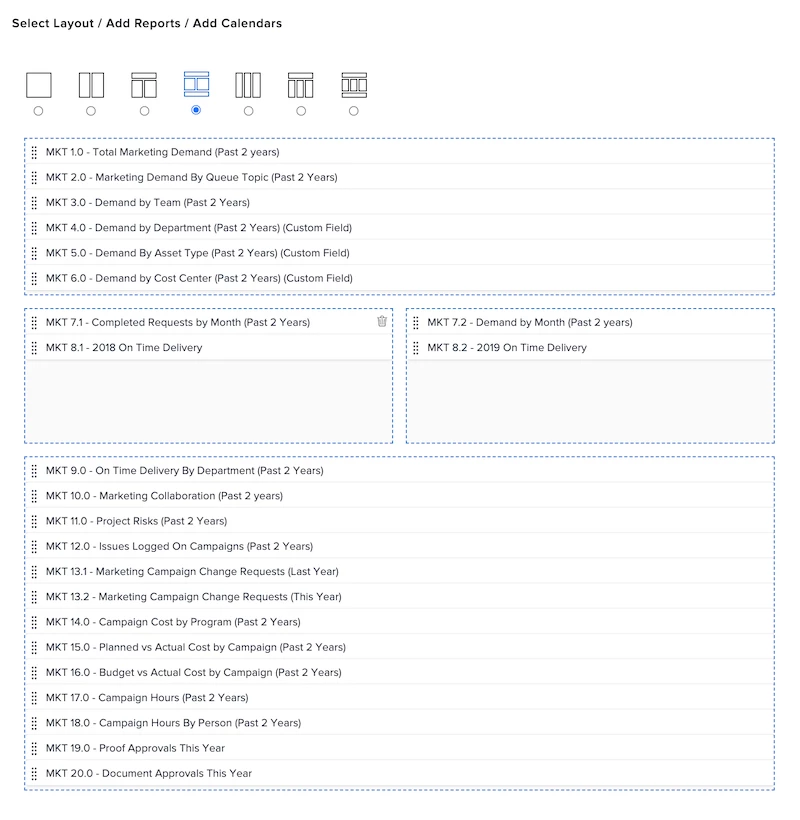
- Select your preferred dashboard layout.Drag and drop the KPI reports you want in your dashboard onto the layout. If using all 23 reports, we recommend organizing them as shown in the image below.
- Click Save + Close
You now have a KPI dashboard to call your own. You’re ready to start visualizing and quantifying your team's demand, productivity, and resource utilization! But your work isn’t done quite yet. It’s time to mold this standard dashboard into something relevant and consumable for you and your stakeholders.
Note: When you look closely at the reports in this dashboard, you will notice that several of them rely on specific object structures in Workfront that may differ from your organization’s structure. In these cases, steps will need to be taken beyond what is listed below to fine-tune the dashboard to add real value to your organization. Don’t hesitate to reach out to your CSM or Adobe Workfront Account Team for additional support with this process.
________________________________________________________________________________________
Customize and validate your dashboard
The kick-start won’t be a perfect fit for every configuration of Workfront immediately upon import. The intention of the kick-start is to act as a starting point. To take full advantage of the dashboard, we recommend these five steps to make the dashboard your own and better surface the information that matters for your organization.
Step 1: Remove irrelevant reports
Not every report will apply to your organization. Click into the reports to understand what information they capture before making a judgement call.
When reviewing the reports, remember that a lack of data does not mean it is useless. Are some of the reports blank because the fields don’t exist in your instance? Do those fields not exist because the information is irrelevant to your organization, or is this an opportunity to improve the way you use Workfront? Consider each report carefully and remove from the dashboard any that will detract from the overall message you need to convey.
Step 2: Troubleshoot error messages
Perhaps a few of the remaining reports that are critical to your organization are malfunctioning and displaying an error message. It is important to understand what the error message is telling you about the data in the system. The three most common reporting error messages are:
- Too much data—The report contains more data than can be displayed at one time. The report needs to be filtered to narrow in on a more specific set of data.
- No data to display—There is no data in the system matching the filters used in the report. The filters need to be adjusted to capture a feature utilized during the specified time frame.
- Let’s try that again—The object or custom field does not exist in your system. Add the field to your system and begin gathering the data or edit the filter to capture a field that exists already.
For a refresher on how to create filters, see the Create or edit filters article or the Create a basic filter learning path on Experience League Workfront Courses.
Step 3: Format your reports
You’ve probably heard the saying, “A picture is worth a thousand words.” That is especially true when talking about data.
Don’t overwhelm stakeholders with too much information. Your goal is to make the dashboard as consumable as possible. Take the time to evaluate the format of each report and change it if the default chart is not going to benefit the intended audience.
Workfront supports six types of charts: column, bar, pie, line, gauge, and bubble. Change the chart by selecting Edit from the Report Actions menu when viewing the report, then selecting the Chart tab in the report builder window.
Check out the Add a chart to a report article for more information on how to customize report formatting.
Step 4: Validate your data
Reports are only as accurate as the data captured in Workfront. Just because you see data populating in your reports does not make it accurate. Proper project management across your teams is essential.
Before using your dashboard to make strategic decisions or distributing it widely, it is recommended that you and your teams sync up on the following Workfront practices to ensure your data is both complete and accurate.
- Maintain request queues and establish a request review committee to ensure timely response.
- Update and use project templates for repeatable types of work.
- Enter accurate percent complete estimates on issues, tasks, and projects.
- Utilize project start and end dates.
- Maintain project timelines.
- Connect projects to the proper portfolios and programs.
- Communicate about work through updates and proofs.
Remember that this is a process that may require onboarding to a new way of working. It’s OK to do this data validation in phases and at a pace comfortable for you and your team.
Step 5: Distribute and communicate
Once you are confident the data is correct and visually appealing, distribute the dashboard with the appropriate Workfront users (group admins, project managers, team leads, etc.). Then send communications about the new dashboard and its reports to team members and leadership.
If your team is already utilizing a team dashboard, consider incorporating some of the KPI reports. If you don’t have a team dashboard, be sure to share the KPI dashboard with all relevant parties by sharing the dashboard itself or adding it to a layout template.
After the dashboard is shared, host a training session with team members to explain the significance of the KPI reports and how these reports are articulating value to leadership. Try to instill a sense of ownership across the team for maintaining the integrity of the data. Refer to the reports/dashboard often to streamline prioritization meetings and make more informed, strategic decisions.
Once everyone doing the work is aligned, distribute the dashboard to your executives. You may want to add the KPI dashboard to the Portfolios or Programs area on the layout templates assigned to your leadership. Remember, executives are looking for the big picture overview, and this dashboard (alongside your portfolios and programs) provides that information.
Once you determine a strategy for distribution, identify the best way to introduce the dashboard so that it doesn’t get lost in the shuffle. Maybe this is a leadership meeting, a one-on-one, or an email. Be sure to refer to the dashboard frequently in business cases, discussions, and strategy meetings to reinforce the value your team brings to the organization.
For tips and tricks regarding how to share a dashboard, see the Get started with dashboards help article on Experience League Workfront Documentation.

- Planner fundamentals, Part 3: Manage a Project
- Manage Your Team’s Work Using Dashboards.
- Create or edit filters
- Create a basic filter
- Add a chart to a report
- Get started with dashboards
________________________________________________________________________________________
By tracking and analyzing key performance indicators, you have the data needed to identify areas for strategic and operational improvement, drive analytical decision making, focus your team’s efforts, and quantify value.
As you completed this learning path, you may have identified other KPIs that are significant to your organization and want to set up reports to track those. Don't forget that you can set up reports to display the custom data collected through custom forms on projects, tasks, etc. For more information on how to gather custom data in Workfront, see the Custom Data learning program on the Experience League Workfront Courses.