This is a problem I'm noticing more and more within Target and I see no literature on dealing with it. When I am looking at test results in Target, in table form I get the following results.
Note that the winning lift is very nearly (but not quite) 4% and the confidence is at 97%.
When I look at the exact same data in the form of average lift over time (where the final day should match exactly with the data above) I get this.
Note that now the winning test is at 3.17% lift, almost a 20% decrease in what the table data reported.
When I look at the exact same data in Adobe Analytics, I get the following:
Now the winning test has a lift of over 4% (Keep in mind this all within the same time period of checking). The number of visitors in this version is also slightly different from the tabular version.
Now when I export the test data by day from Workspace, I get the following:
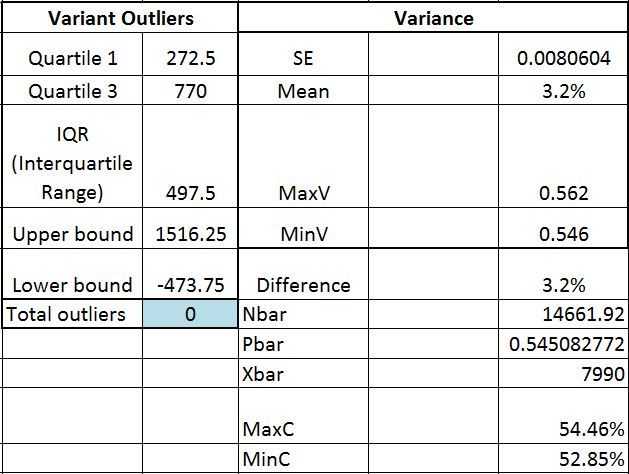
The "Difference" (Fifth Row on the right) shows the final accumulated difference in conversion rates. It's 3.2% (Or more accurately 3.17, matching what we saw in the graph data).
So my question is, which one of these is correct, and why are they so different? Why does Workspace data match the Target average lift over time, but it does not match the tabled data or the data that appears within the main Analytics dashboard for test results. Shouldn't you make it expressly clear that these results differ? Does the analytics dashboard and Target tabular data always provide a higher lift than what actually exists?
I should also point out that this is not just a matter of the data needing time to refresh. Looking at previous days of data collection the same result occurs- the lift over time graph and exported data from workspace is a significantly different value from the reported result in Analytics.
Solved! Go to Solution.
Views
Replies
Total Likes
Hi CSAnderson,
Please submit a ticket to ClientCare about this (please include your versions of at.js, MCID and appmeasurement.js). I have seen the Target graph view y-axis labels not match the tabular results in the past. Could be a bug causing that. On comparing the Target Tabular with the Analytics tabular the numbers are very close to each other. Close enough that it seems like it could be a difference of running the reports a few minutes apart. Do you see this same difference if you don't include the current day? There certainly could be something else going on but it will require a closer look from ClientCare I think. Target data should match exactly to Analtyics data. As, they are using the same data source. Furthermore, Analtyics workspaces should match exactly with the Analytics tabular report. Thanks for raising this so we can look into it further.
Views
Replies
Total Likes
Views
Like
Replies
Views
Like
Replies