How to debug Profile Scripts
![]()
- Mark as New
- Follow
- Mute
- Subscribe to RSS Feed
- Permalink
- Report
Hello!
How do you go about debugging profile scripts?
I assume a normal console.log doesn't work since its server side?
Thanks!
Gyles
Solved! Go to Solution.

- Mark as New
- Follow
- Mute
- Subscribe to RSS Feed
- Permalink
- Report
Hi Gyles,
You are correct console.log isn't helpful because they run server side. There are two methods that I use to debug them.
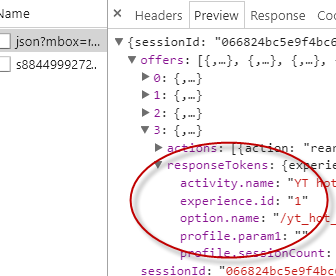
1. Add them as response tokens. This is easy to do: target > setup > response tokens enable the profile you want to debug. Now any time you load a page for your site with Target on it part of the response from Target will contain your value for the given profile script.
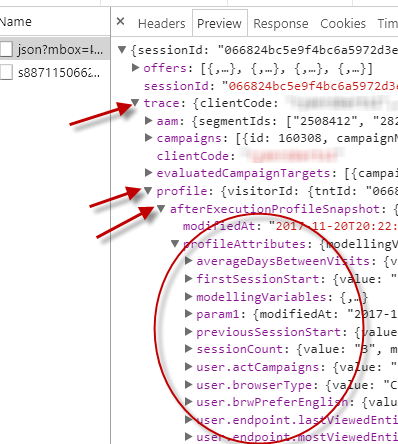
2. The other option is to use the mboxTrace debugging tool. This requires the an authorization token found here: target > setup > implemenation > authorization. Then you add these 2 parameters to your page url after the "?" mboxTrace=window&authorization=YOURTOKEN.
This is a little more informative than the response token because you get a before executed snapshot and an after snapshot of your profile. It will also show all the profiles availalbe for your profile.
![]()
- Mark as New
- Follow
- Mute
- Subscribe to RSS Feed
- Permalink
- Report
I have same question.
Please do share if you were able to figure out.
Regards
Yogita

- Mark as New
- Follow
- Mute
- Subscribe to RSS Feed
- Permalink
- Report
Hi Gyles,
You are correct console.log isn't helpful because they run server side. There are two methods that I use to debug them.
1. Add them as response tokens. This is easy to do: target > setup > response tokens enable the profile you want to debug. Now any time you load a page for your site with Target on it part of the response from Target will contain your value for the given profile script.
2. The other option is to use the mboxTrace debugging tool. This requires the an authorization token found here: target > setup > implemenation > authorization. Then you add these 2 parameters to your page url after the "?" mboxTrace=window&authorization=YOURTOKEN.
This is a little more informative than the response token because you get a before executed snapshot and an after snapshot of your profile. It will also show all the profiles availalbe for your profile.

- Mark as New
- Follow
- Mute
- Subscribe to RSS Feed
- Permalink
- Report
Do you know how to that using Web SDK? 😄
Views
Replies
Total Likes
![]()
- Mark as New
- Follow
- Mute
- Subscribe to RSS Feed
- Permalink
- Report
- Mark as New
- Follow
- Mute
- Subscribe to RSS Feed
- Permalink
- Report
Hi Yogita,
Hope you doing well!.
Are you writing profile scripts these days.
Regards
Harpreet Singh (ex-colleague)
![]()
- Mark as New
- Follow
- Mute
- Subscribe to RSS Feed
- Permalink
- Report
Yes, is there anything specific you would like to enquire about?
- Mark as New
- Follow
- Mute
- Subscribe to RSS Feed
- Permalink
- Report
Nothing specific - So what all scenarios you have created profile scripts
Views
Likes
Replies
Views
Likes
Replies


